Go pprof
Jan 28, 2020 00:00 · 1444 words · 3 minute read


pprof 包可以用来采集 Golang 实现的应用程序运行时的数据,为 pprof 可视化工具提供数据源。
有两种 pprof 包:
- runtime/pprof 采集非 HTTP Server 的运行时数据
- net/http/pprof 采集 HTTP Server 的运行时数据
如果你的进程是 HTTP 服务器应用程序,只需要在程序中关联 net/http/pprof 包:
import _ "net/http/pprof"
首先我们编写一个简单的 web server:
import (
    "log"
    "net/http"
    _ "net/http/pprof"
)

func root(w http.ResponseWriter, r *http.Request) {
    w.Write([]byte("Hello World!"))
}

func main() {
    http.HandleFunc("/", root)
    err := http.ListenAndServe(":8080", nil)
    if err != nil {
        log.Fatal("err:", err)
    }
}
go run 这段代码后通过访问 http://localhost:8080/debug/pprof 来打开当前总览:
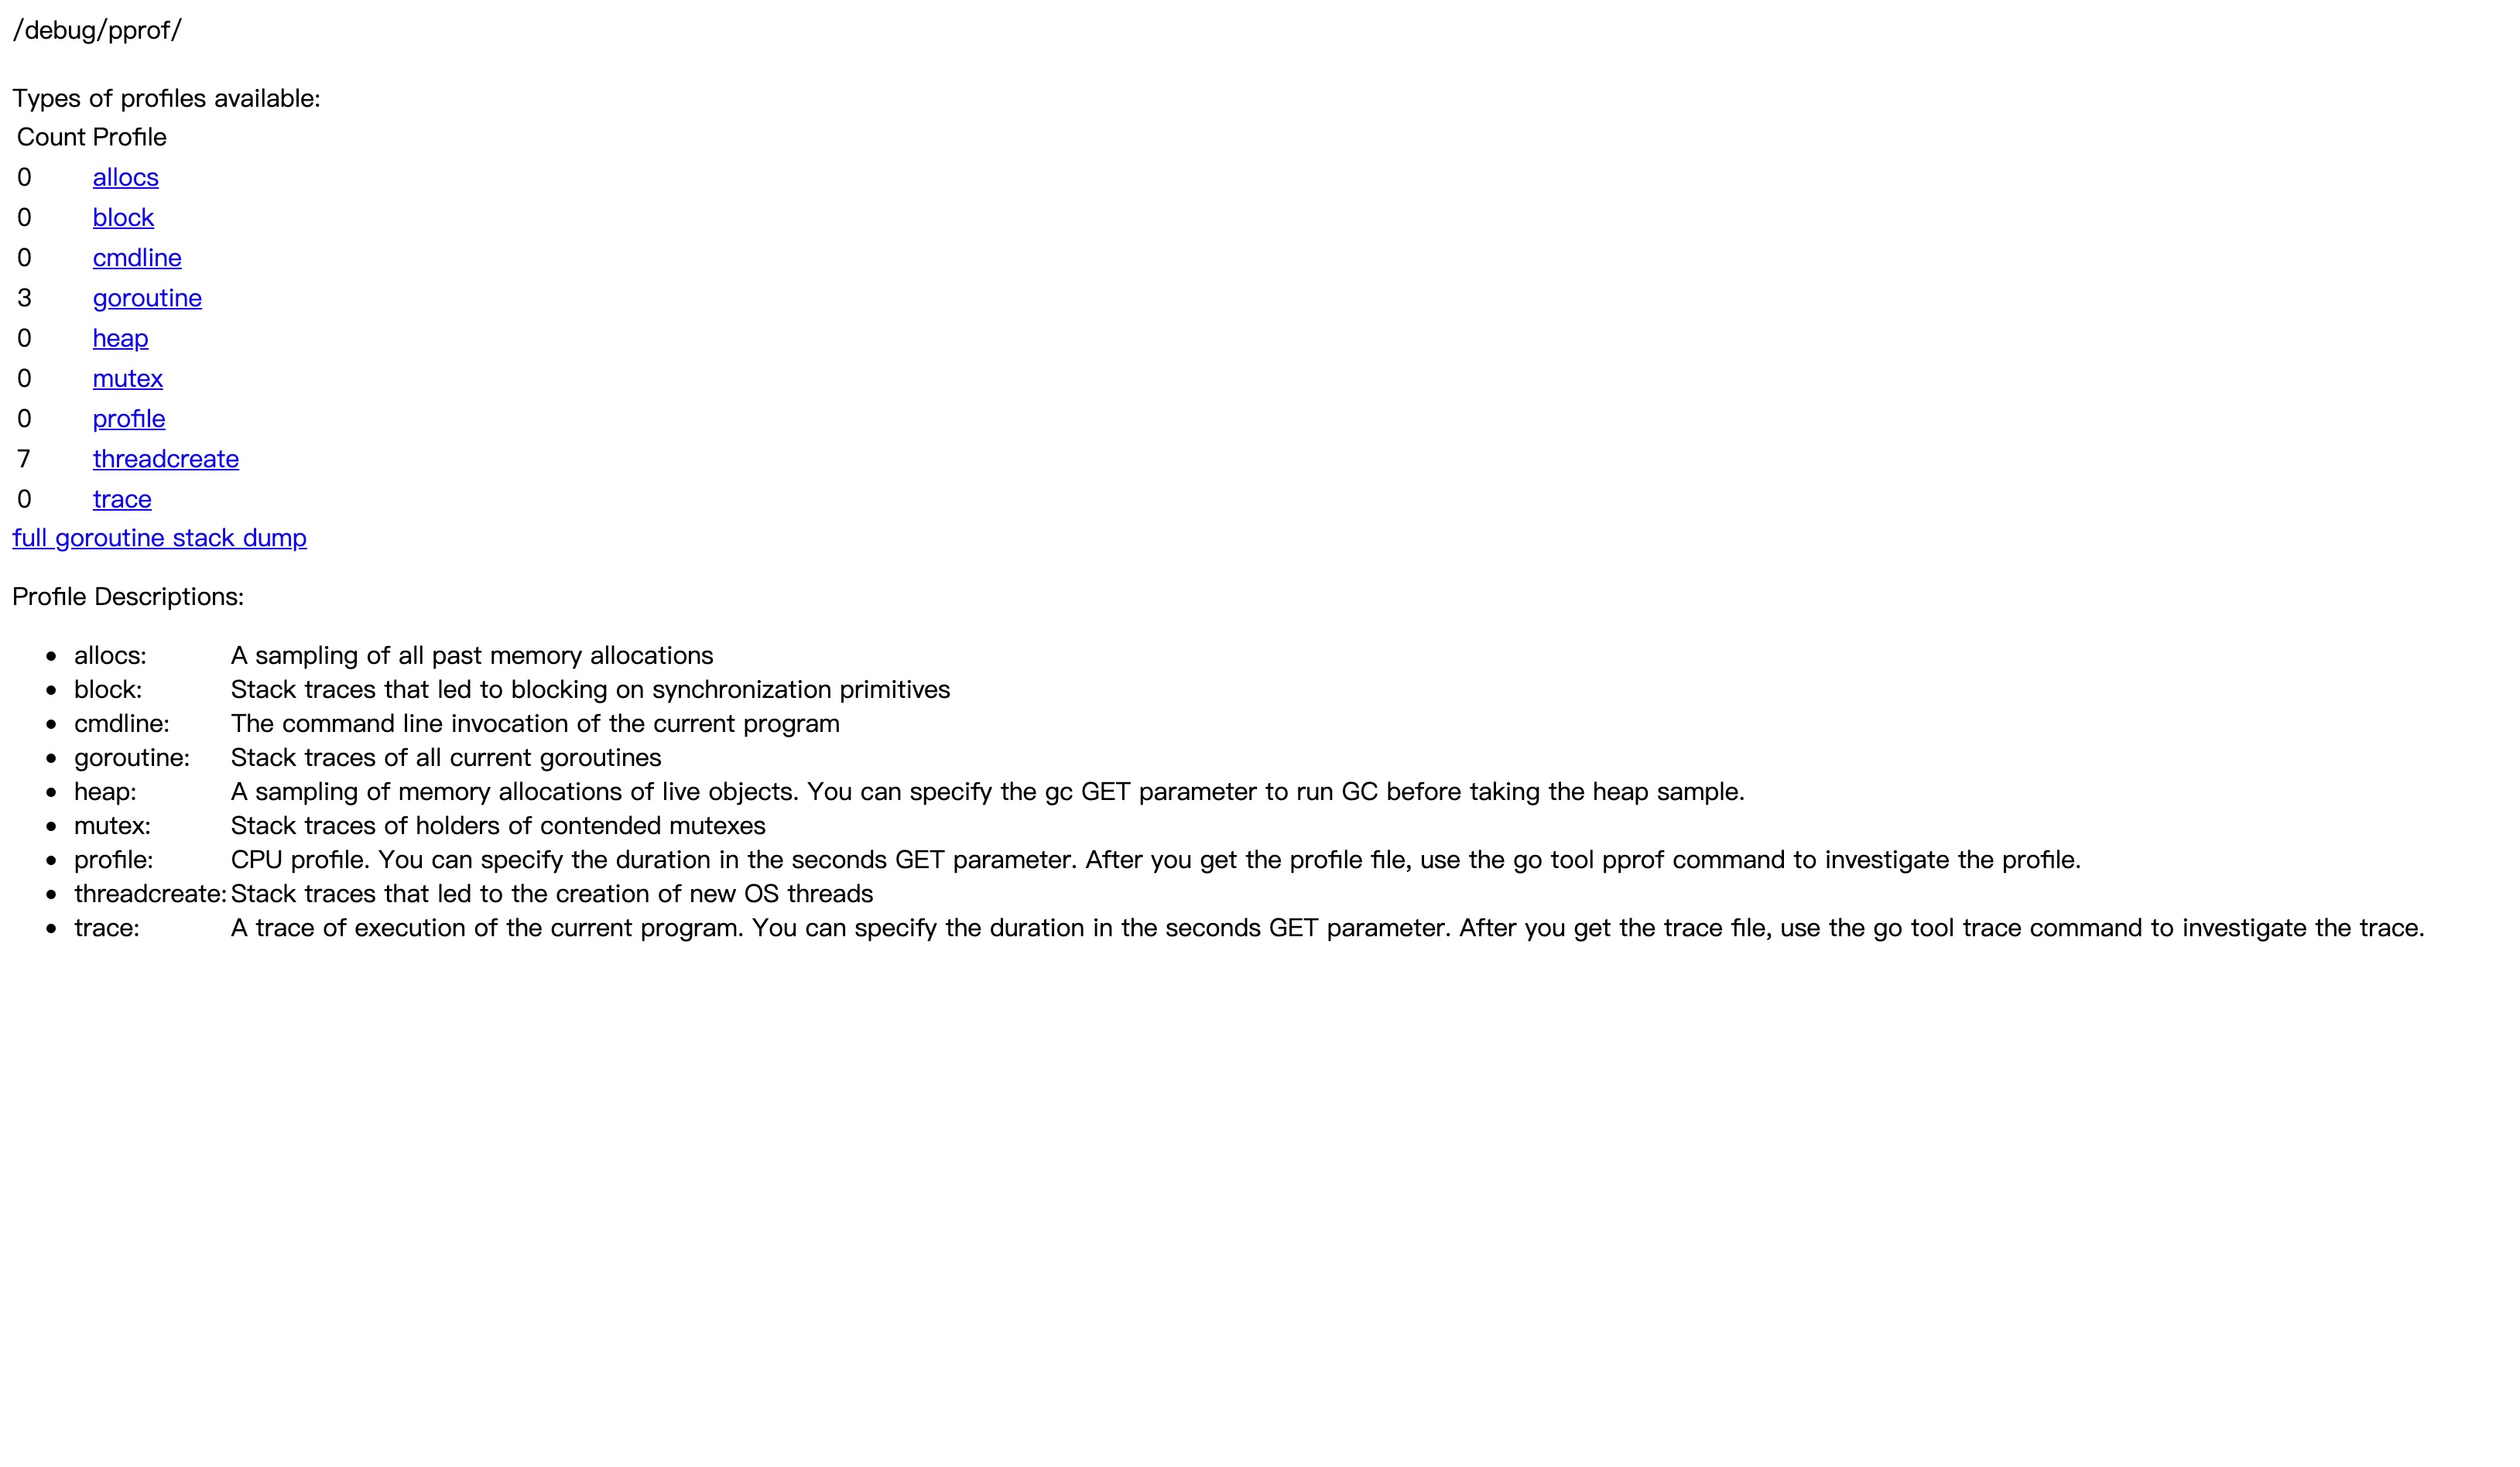
| 采样类型 | 说明 | url |
|---|---|---|
| block | goroutine 阻塞事件记录 | http://localhost:8080/debug/pprof/block |
| goroutine | 活跃的协程采样 | http://localhost:8080/debug/pprof/goroutine |
| heap | 堆内存采样 | http://localhost:8080/debug/pprof/heap |
| mutex | 互斥锁采样 | http://localhost:8080/debug/pprof/mutex |
| profile | CPU 采样 | http://localhost:8080/debug/pprof/profile |
| threadcreate | OS 新线程创建 | http://localhost:8080/debug/pprof/threadcreate |
我们访问 http://localhost:8080/debug/pprof/profile 或执行 curl http://localhost:8080/debug/pprof/profile 来得到一份 30 秒的 CPU 样本。
所谓样本,就是堆栈追踪的集合,显示导致特定事件(内存分配)的调用序列。
CPU 采样分析
使用 go tool pprof $PROFILE_NAME 来分析已有样本,也可以直接 go tool pprof http://localhost:8080/debug/pprof/profile?seconds=60 等 60 秒现场采样。采样的同时可以使用一些压力测试工具来辅助,在这里我使用 siege
$ siege http://localhost:8080/
HTTP/1.1 200     0.02 secs:      12 bytes ==> GET  /
HTTP/1.1 200     0.02 secs:      12 bytes ==> GET  /
HTTP/1.1 200     0.02 secs:      12 bytes ==> GET  /
HTTP/1.1 200     0.02 secs:      12 bytes ==> GET  /
HTTP/1.1 200     0.01 secs:      12 bytes ==> GET  /
HTTP/1.1 200     0.02 secs:      12 bytes ==> GET  /
HTTP/1.1 200     0.02 secs:      12 bytes ==> GET  /
HTTP/1.1 200     0.02 secs:      12 bytes ==> GET  /
go tool pprof "http://localhost:8080/debug/pprof/profile?seconds=60"
Fetching profile over HTTP from http://localhost:8080/debug/pprof/profile?seconds=60
Saved profile in /Users/crazytaxii/pprof/pprof.samples.cpu.007.pb.gz
Type: cpu
Time: Jan 27, 2020 at 9:06pm (CST)
Duration: 1mins, Total samples = 3.03s ( 5.05%)
Entering interactive mode (type "help" for commands, "o" for options)
(pprof) top
Showing nodes accounting for 2560ms, 84.49% of 3030ms total
Dropped 55 nodes (cum <= 15.15ms)
Showing top 10 nodes out of 137
      flat  flat%   sum%        cum   cum%
    1210ms 39.93% 39.93%     1210ms 39.93%  syscall.syscall
     310ms 10.23% 50.17%      310ms 10.23%  runtime.pthread_cond_wait
     240ms  7.92% 58.09%      240ms  7.92%  runtime.kevent
     230ms  7.59% 65.68%      230ms  7.59%  runtime.pthread_cond_signal
     150ms  4.95% 70.63%      150ms  4.95%  runtime.nanotime
     120ms  3.96% 74.59%      120ms  3.96%  syscall.syscall6
     100ms  3.30% 77.89%      110ms  3.63%  runtime.usleep
      80ms  2.64% 80.53%      280ms  9.24%  runtime.netpoll
      60ms  1.98% 82.51%     1280ms 42.24%  net/http.(*conn).serve
      60ms  1.98% 84.49%       60ms  1.98%  runtime.pthread_cond_timedwait_relative_np
(pprof)
- flat 当前函数执行时间(CPU 占用)
- flat% 当前函数执行时间比例
- sum% 当前函数累计执行时间总比例
- cum 当前函数加它的调用的所有子函数运行总耗时
- cum% 当前函数加它的调用的所有子函数运行总耗时比例
详细定义请查看 https://github.com/google/pprof/blob/master/doc/README.md
我们再执行一下 (pprof) web(需要安装 Graphviz 这个工具),自动生成一张 函数调用关系 SVG 图:
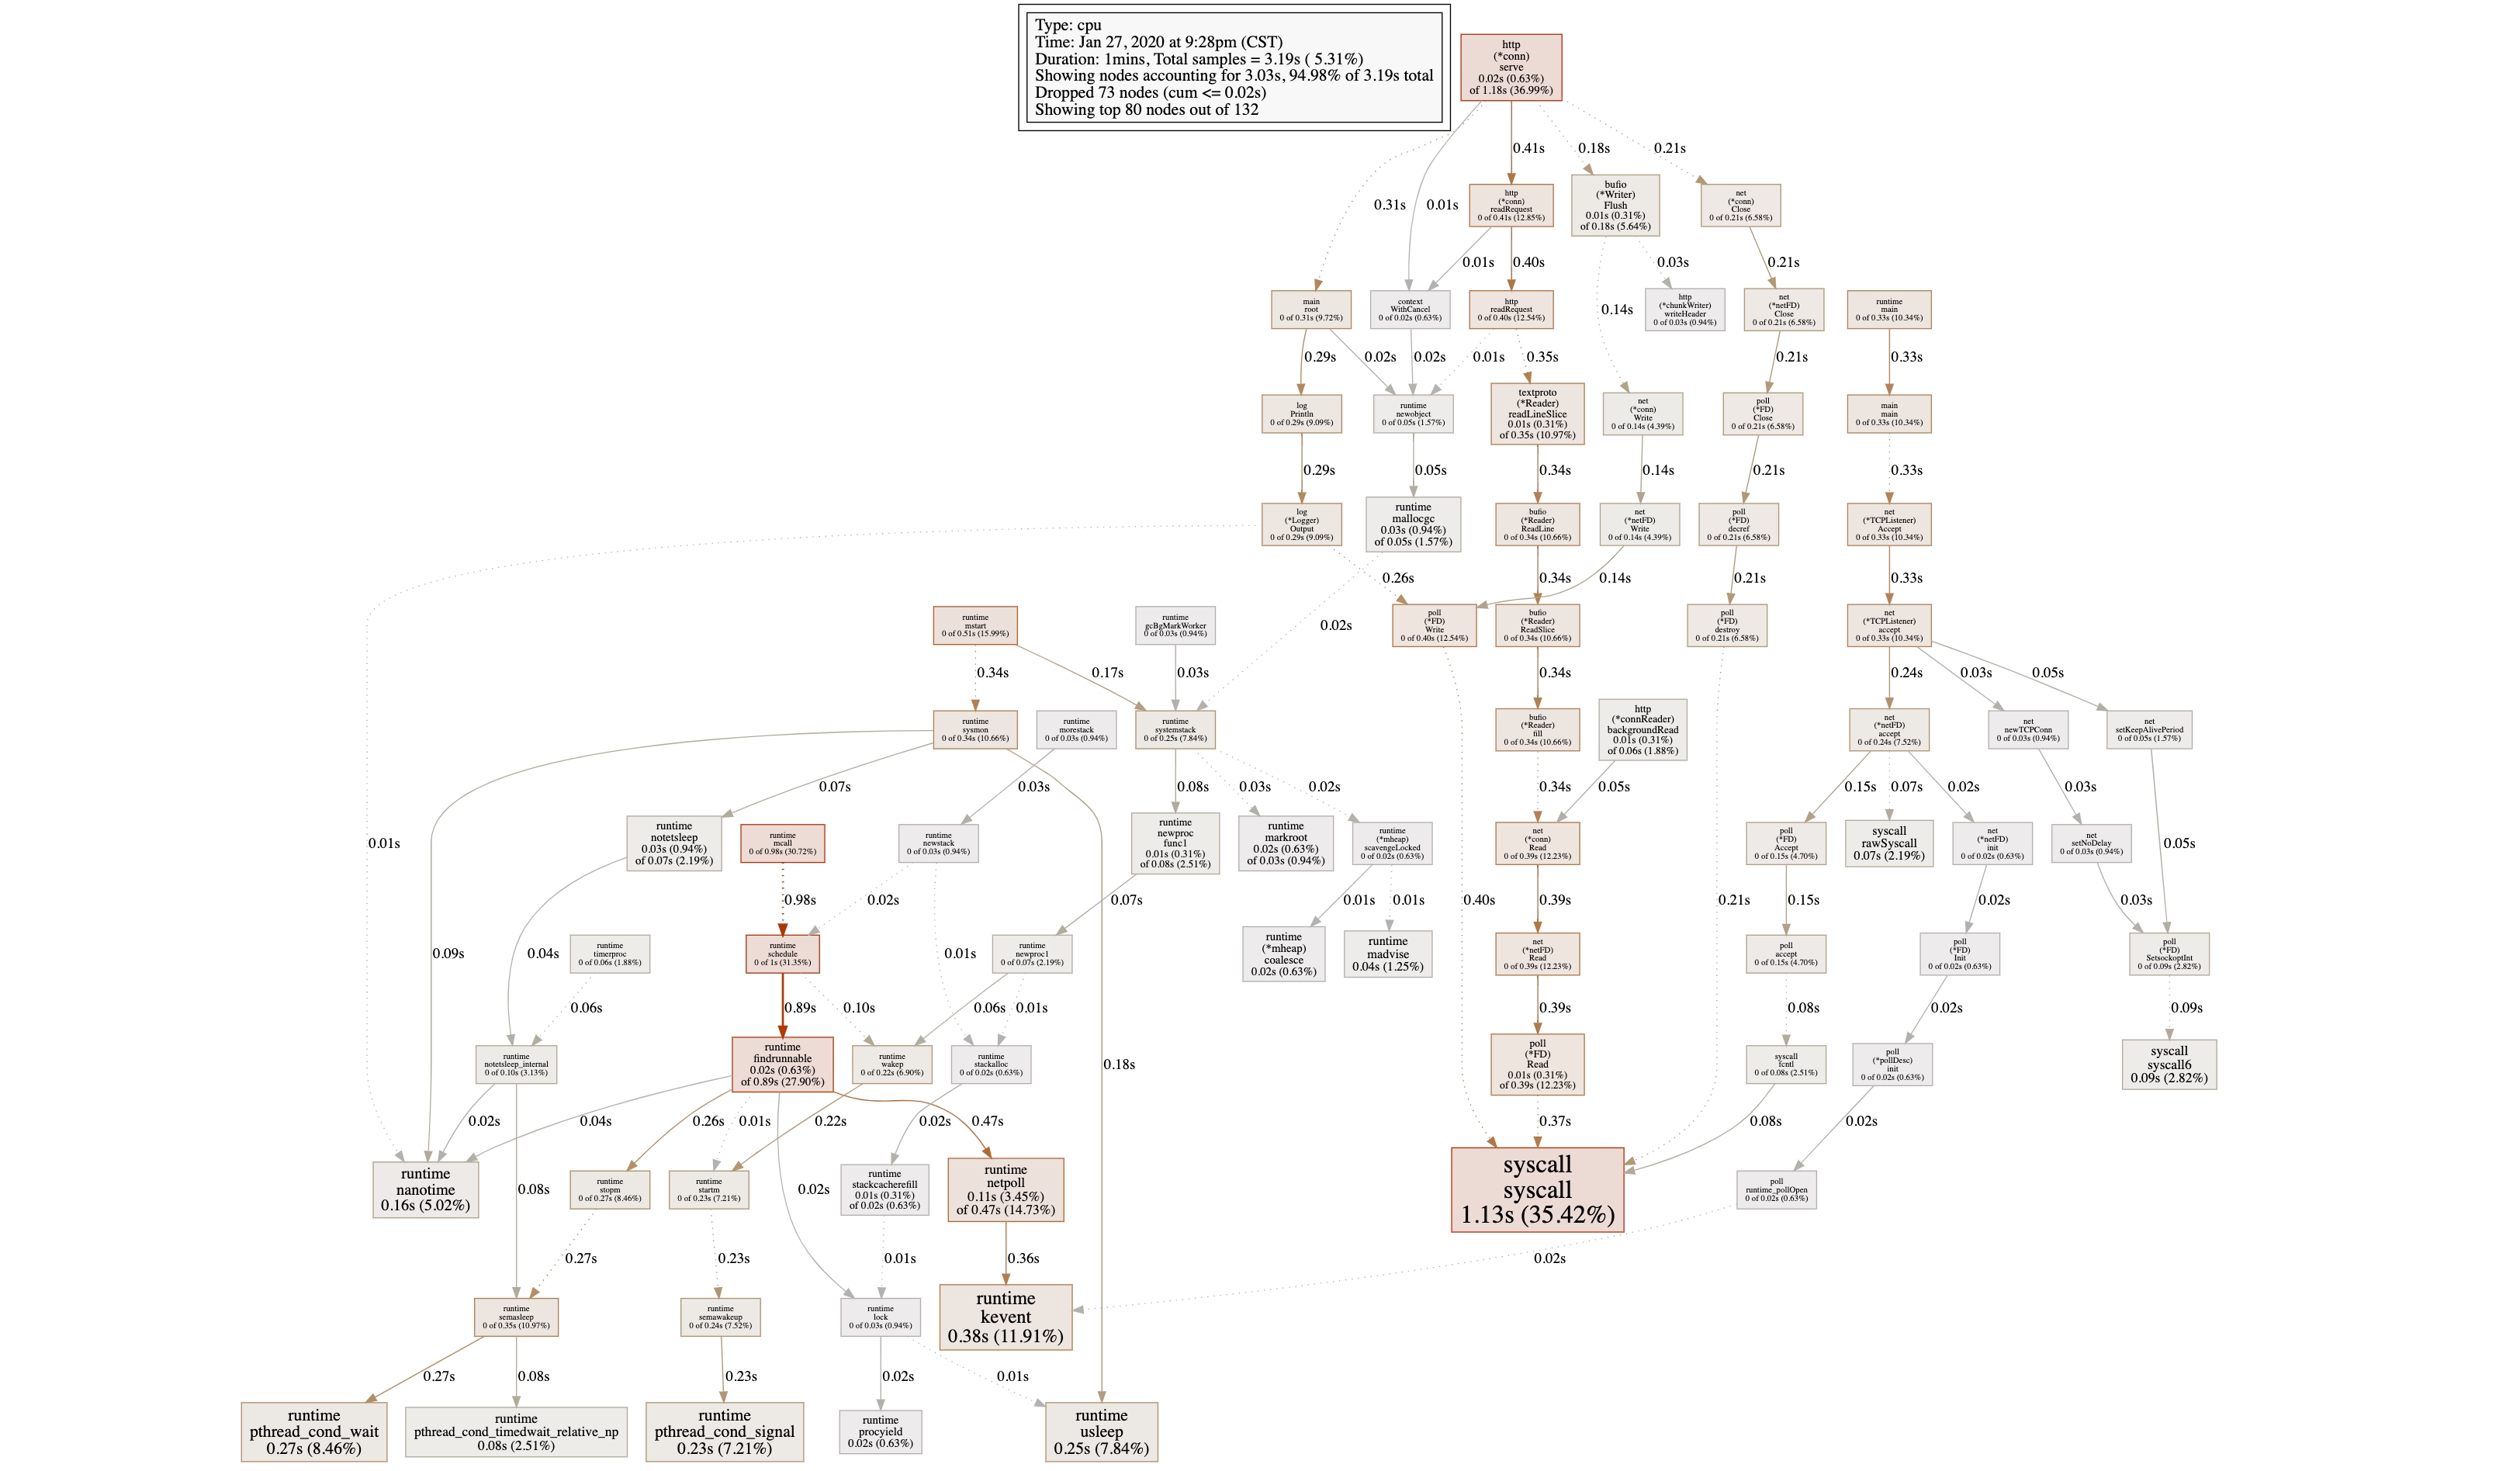
图中每个方框对应一个函数,方框内有函数名和执行时间,方框越大对应函数的执行时间越久。方框之间的箭头则表示调用逻辑,箭头上标着被调用函数的执行时间。有了这个图我们就可以从自己代码的入口函数开始去追踪整个程序逻辑,判断出程序有性能问题的地方。
利用 (pprof) list 命令甚至可以精确到具体代码级别:
(pprof) list syscall
Total: 3.19s
ROUTINE ======================== syscall.Accept in /usr/local/go/src/syscall/syscall_bsd.go
         0       70ms (flat, cum)  2.19% of Total
         .          .    271:}
         .          .    272:
         .          .    273:func Accept(fd int) (nfd int, sa Sockaddr, err error) {
         .          .    274:	var rsa RawSockaddrAny
         .          .    275:	var len _Socklen = SizeofSockaddrAny
         .       70ms    276:	nfd, err = accept(fd, &rsa, &len)
         .          .    277:	if err != nil {
         .          .    278:		return
         .          .    279:	}
         .          .    280:	if runtime.GOOS == "darwin" && len == 0 {
         .          .    281:		// Accepted socket has no address.
ROUTINE ======================== syscall.Close in /usr/local/go/src/syscall/zsyscall_darwin_amd64.go
         0      210ms (flat, cum)  6.58% of Total
         .          .    514://go:cgo_import_dynamic libc_chroot chroot "/usr/lib/libSystem.B.dylib"
         .          .    515:
         .          .    516:// THIS FILE IS GENERATED BY THE COMMAND AT THE TOP; DO NOT EDIT
         .          .    517:
         .          .    518:func Close(fd int) (err error) {
         .      210ms    519:	_, _, e1 := syscall(funcPC(libc_close_trampoline), uintptr(fd), 0, 0)
         .          .    520:	if e1 != 0 {
         .          .    521:		err = errnoErr(e1)
         .          .    522:	}
         .          .    523:	return
         .          .    524:}
内存采样分析
将 go tool pprof 的数据源改为 http://localhost:8080/debug/pprof/heap
$ go tool pprof "http://localhost:8080/debug/pprof/heap"
Fetching profile over HTTP from http://localhost:8080/debug/pprof/heap
Saved profile in /Users/crazytaxii/pprof/pprof.alloc_objects.alloc_space.inuse_objects.inuse_space.001.pb.gz
Type: inuse_space
Time: Jan 27, 2020 at 11:12pm (CST)
Entering interactive mode (type "help" for commands, "o" for options)
(pprof) top
Showing nodes accounting for 1024.23kB, 100% of 1024.23kB total
      flat  flat%   sum%        cum   cum%
  512.19kB 50.01% 50.01%   512.19kB 50.01%  runtime.malg
  512.05kB 49.99%   100%   512.05kB 49.99%  sync.runtime_notifyListWait
         0     0%   100%   512.05kB 49.99%  net/http.(*conn).serve
         0     0%   100%   512.05kB 49.99%  net/http.(*connReader).abortPendingRead
         0     0%   100%   512.05kB 49.99%  net/http.(*response).finishRequest
         0     0%   100%   512.19kB 50.01%  runtime.mstart
         0     0%   100%   512.19kB 50.01%  runtime.newproc.func1
         0     0%   100%   512.19kB 50.01%  runtime.newproc1
         0     0%   100%   512.19kB 50.01%  runtime.systemstack
         0     0%   100%   512.05kB 49.99%  sync.(*Cond).Wait
使用 top 指令查看占用内存最多的函数。指标名称与 CPU 占用类似,这里是内存大小。
火焰图🔥
如果还是觉得不够直观,那就要用到之前介绍的火焰图来辅助分析了。
曾经需要使用 go-torch 这款 Uber 开源的工具来读取样本生成火焰图,但是 Go 1.11 版本之后直接提供了火焰图功能,所以 go-torch 也就从此退休。直接执行 go tool pprof -http=:8081 $PROFILE_NAME 命令,浏览器会自动打开 http://localhost:8081/ui/。
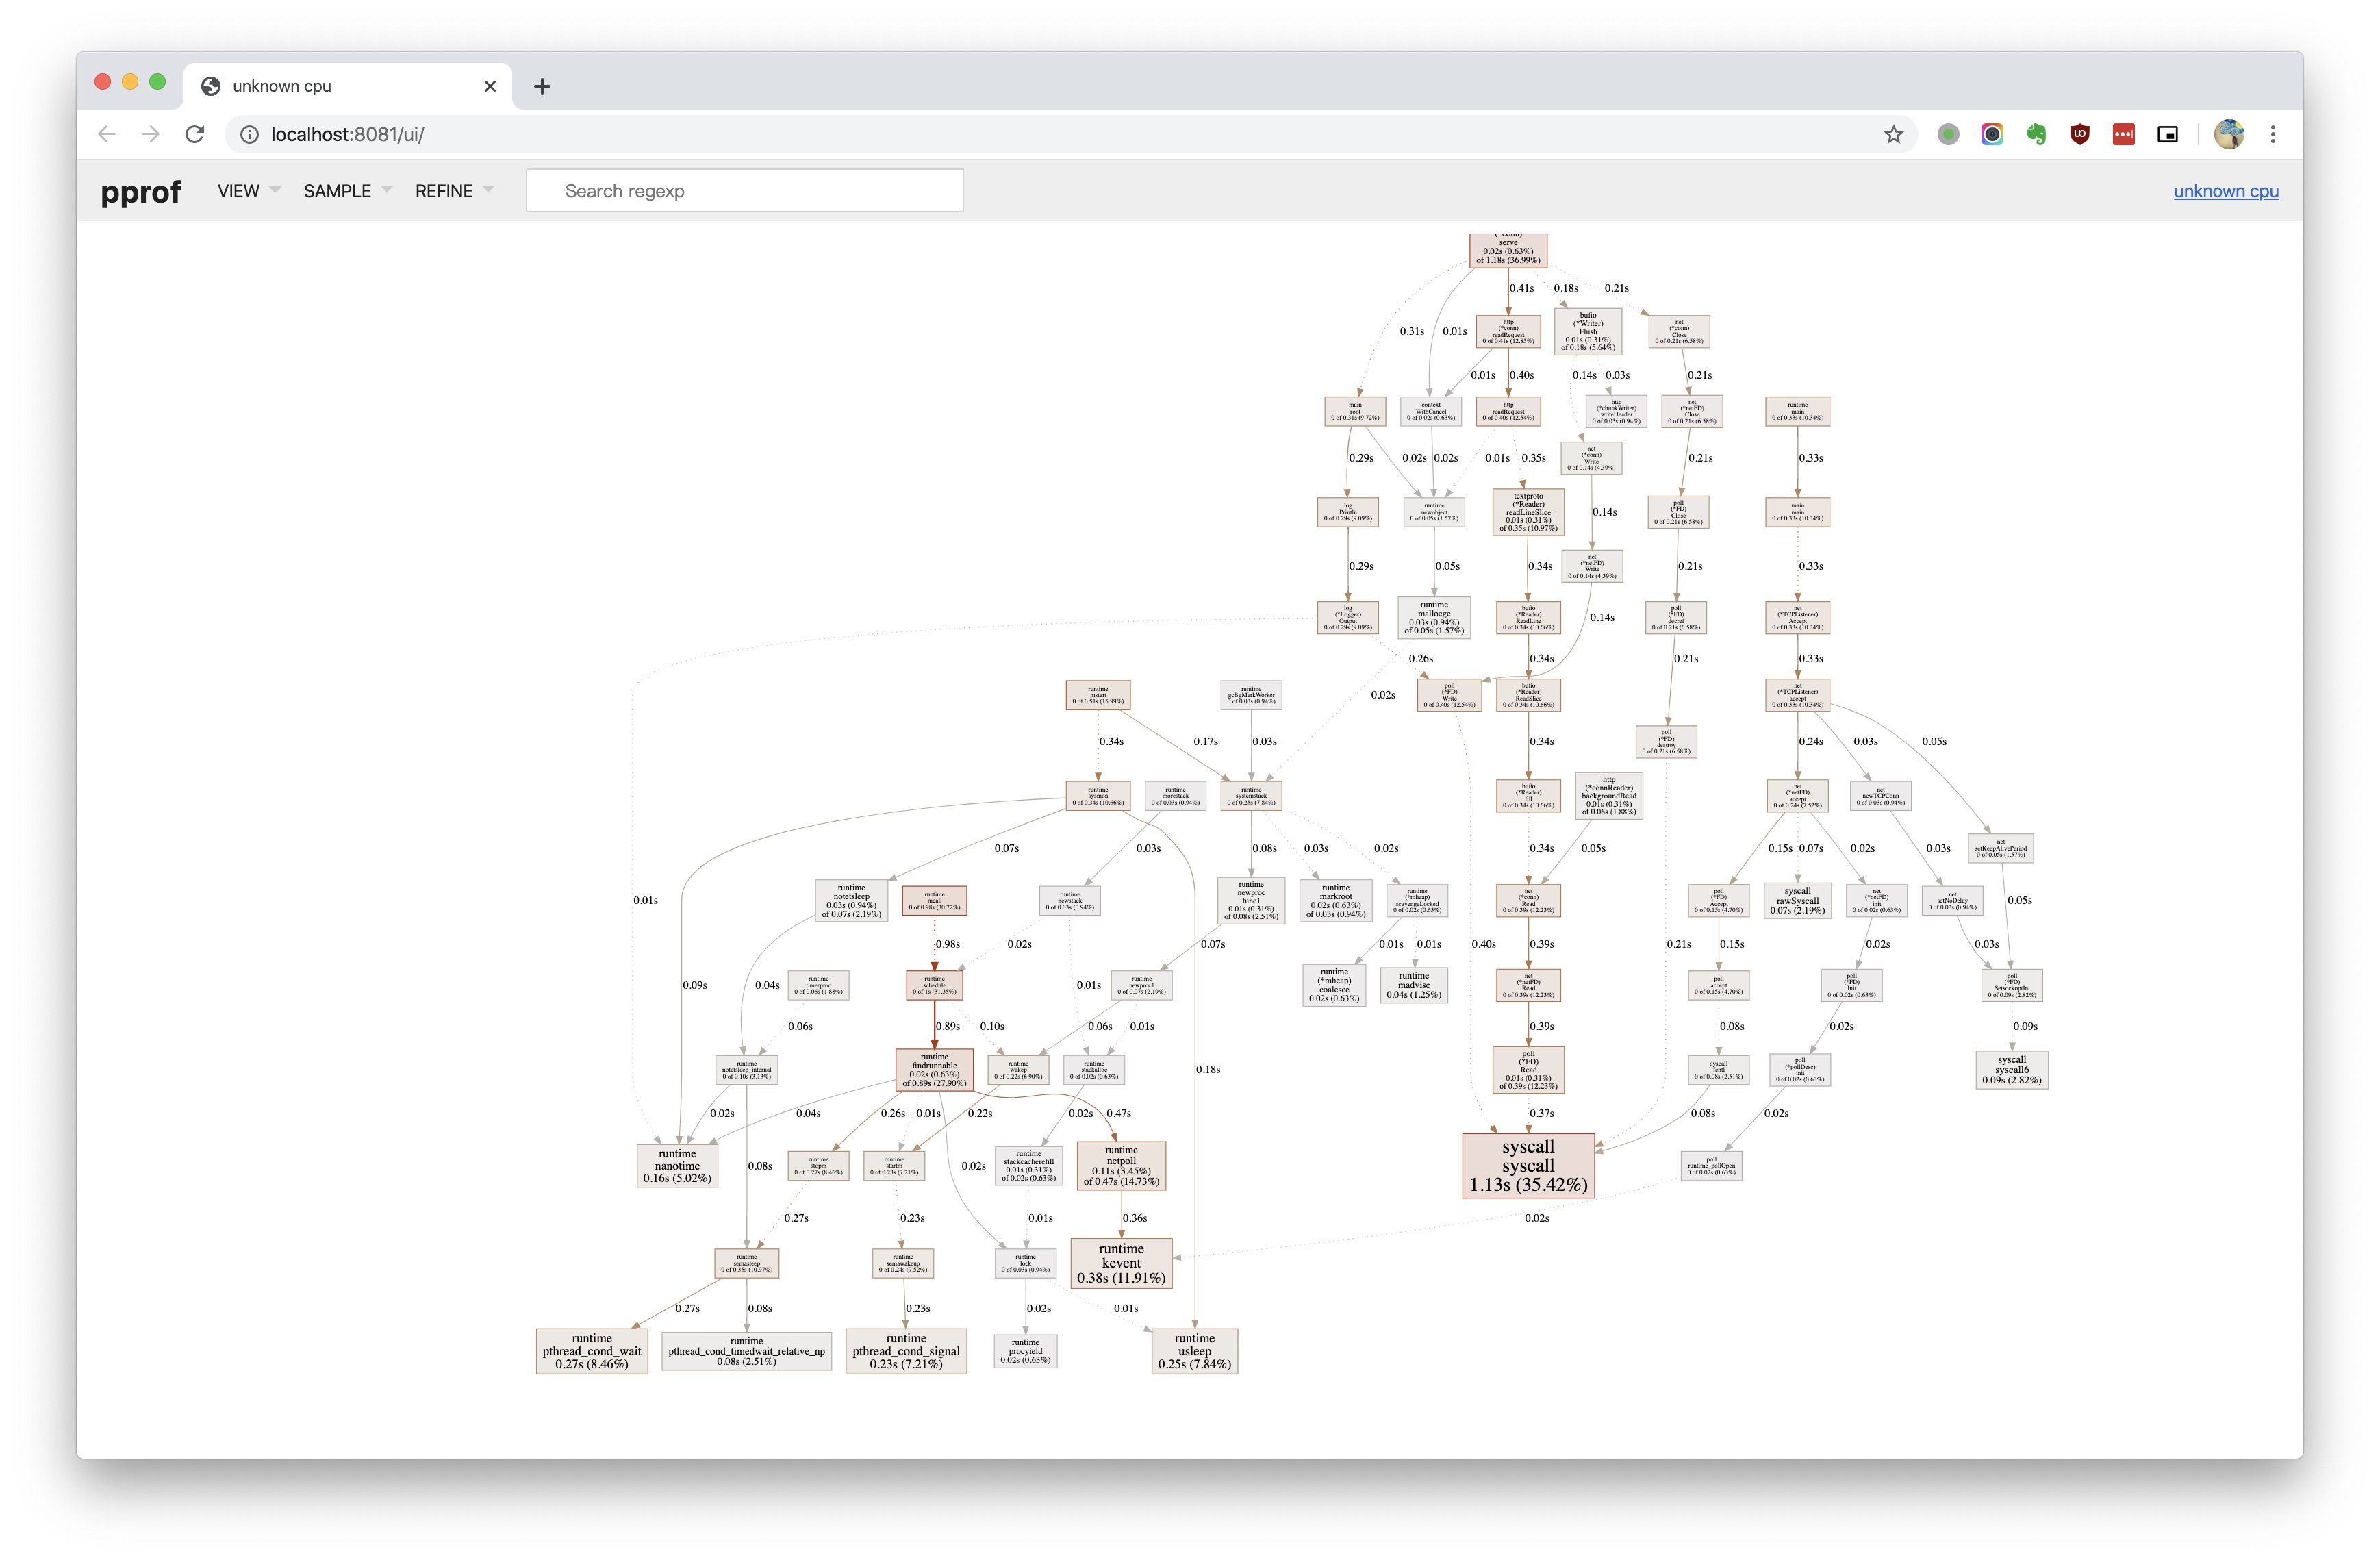
正是之前的函数调用关系图,我们切换至火焰图:
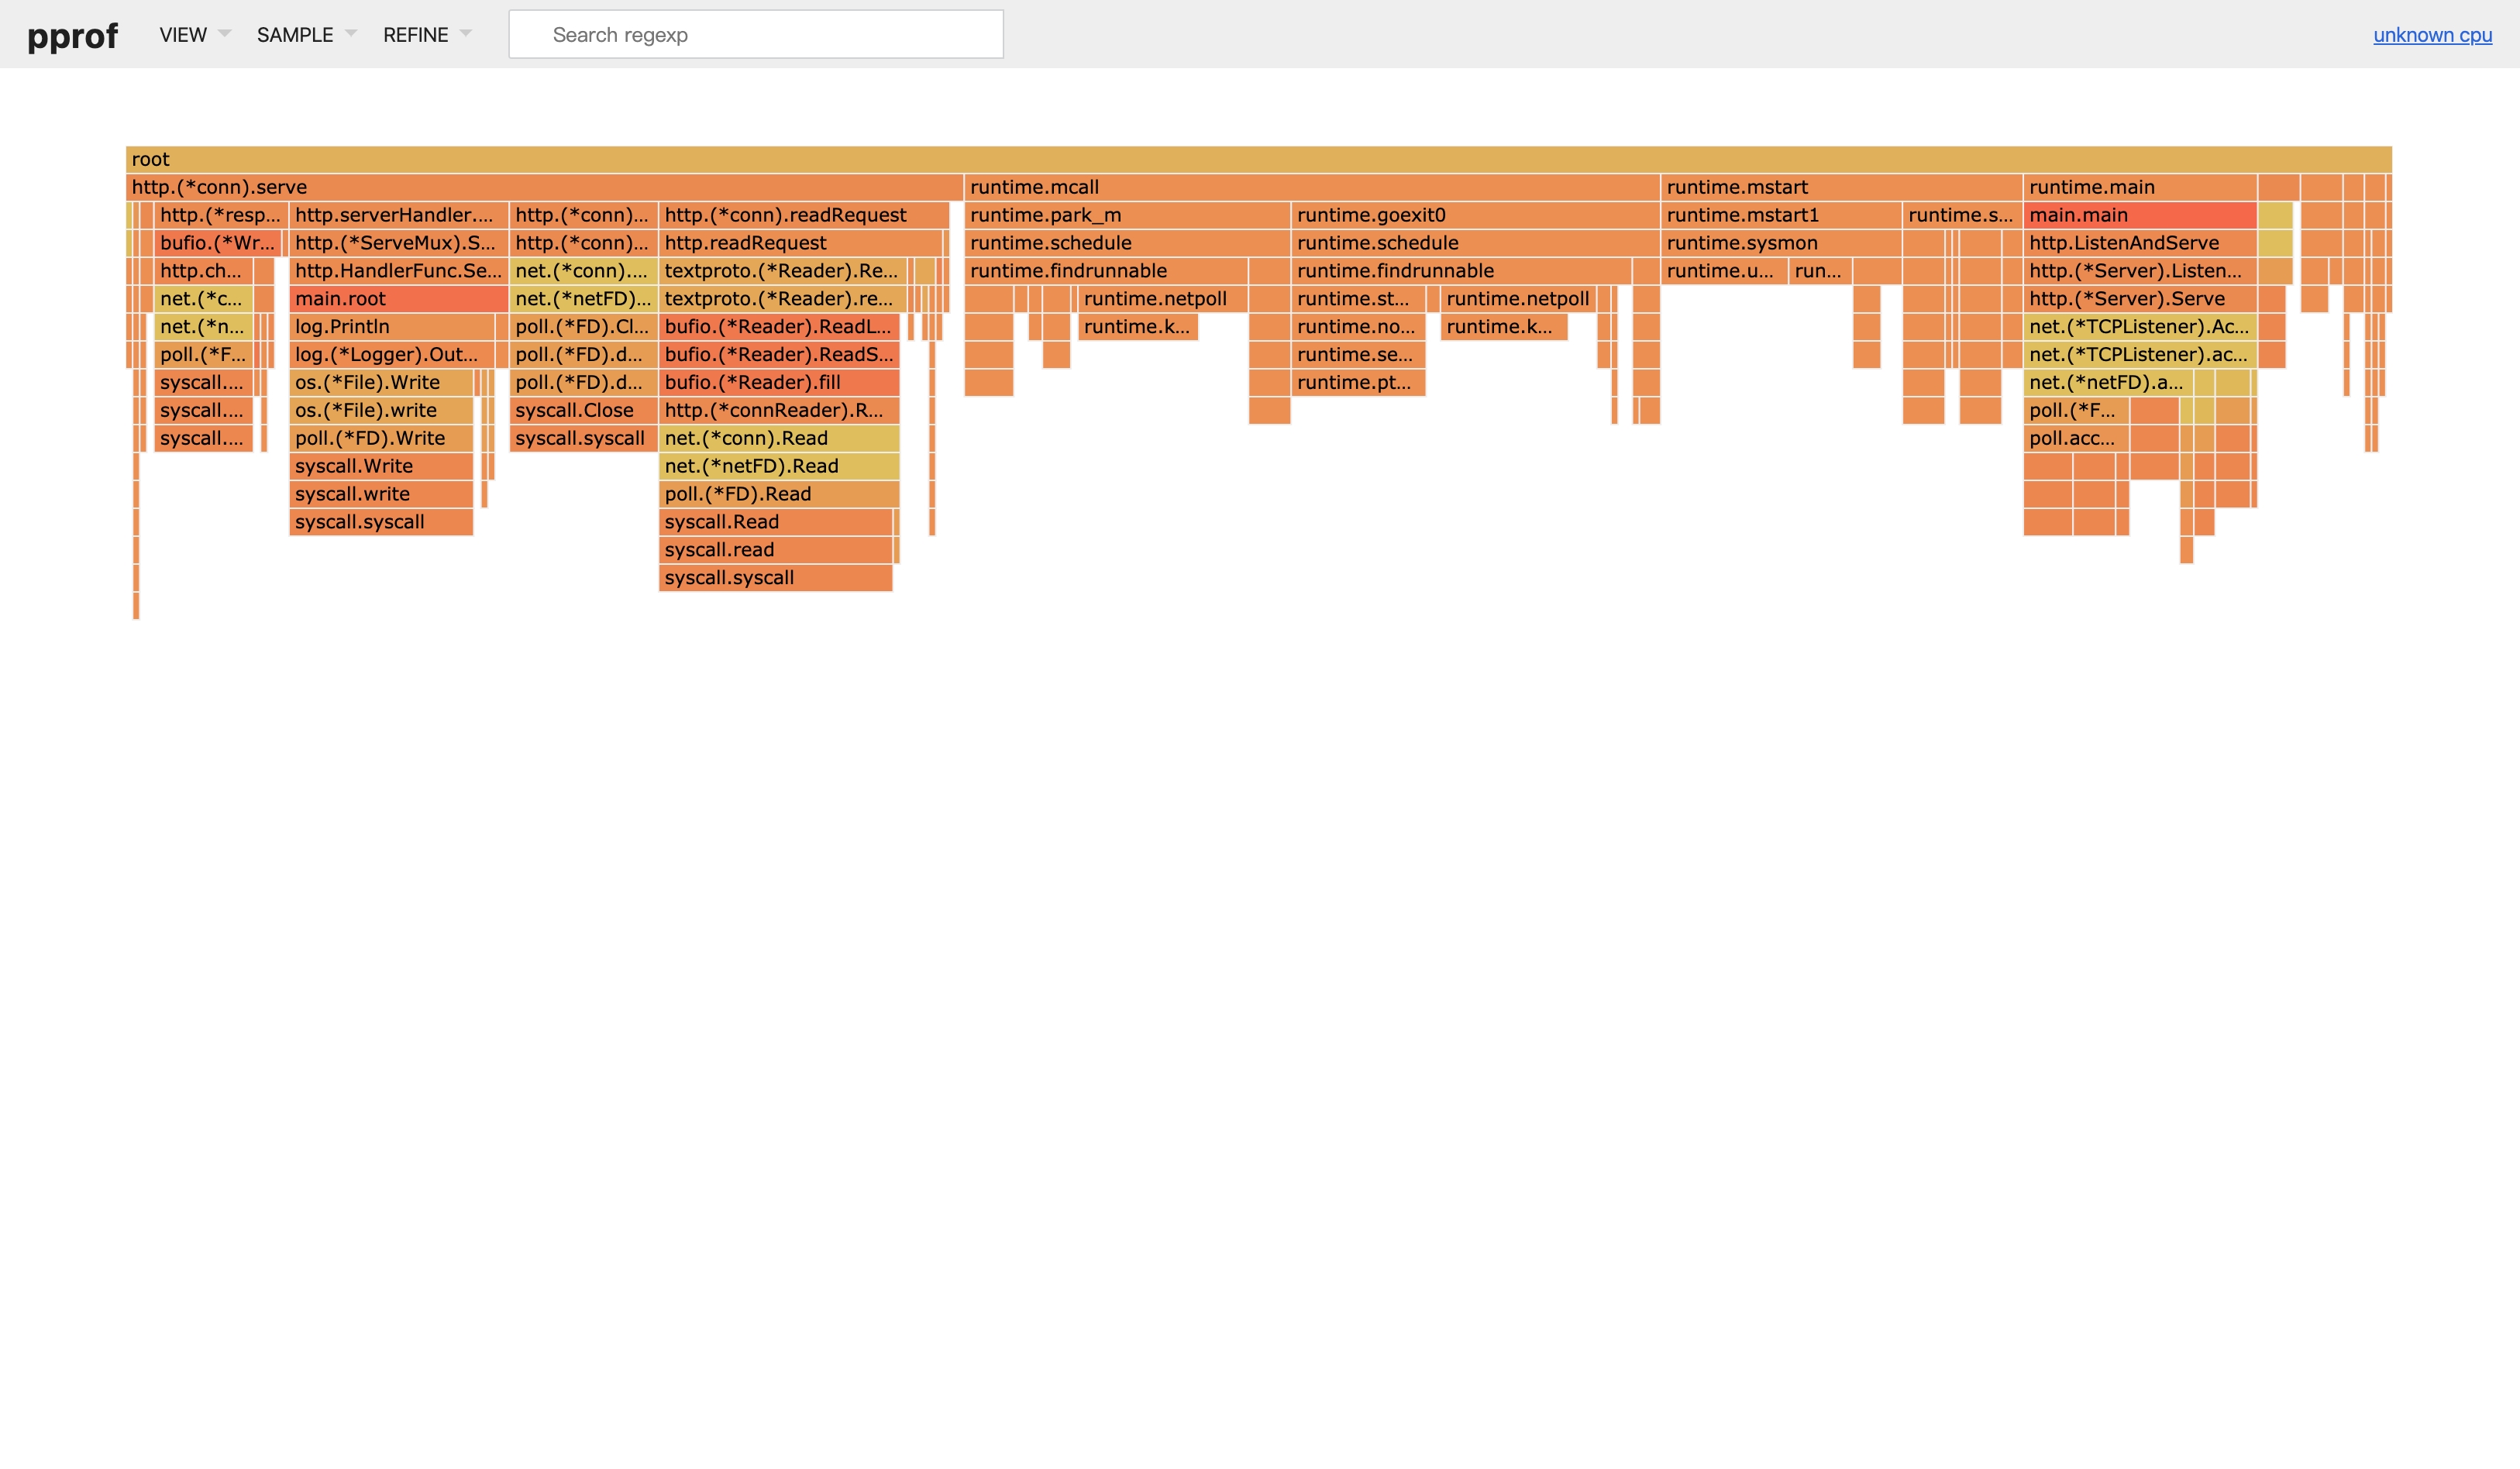
这是一张反的火焰图,火舌向下。。。理论上输出火焰图之后我们要先观察“平顶”火舌,不过这里都是一些 syscall,并不是业务函数,没啥优化的空间。事实上我们的 demo 已经简洁的不能再简洁,不存在什么有性能问题的代码(典型的有正则匹配、JSON 序列化之类)。