Linux KProbes
Oct 21, 2020 21:15 · 6877 words · 14 minute read

译文
介绍
KProbes 是 Linux 内核的一种调试机制,也可以用于监控生产系统内部的事件。你可以用它来找出性能瓶颈,记录特定事件,追踪问题等等。KProbes 作为另一个更高级的追踪工具 DProbes 的底层机制由 IBM 开发。DProbes 增加了众多功能,包括它自己的脚本语言,用于编写探针的处理程序。但是只有 KProbes 被合并入标准内核中。
本文将介绍 2.6.11.7 内核中的 KProbes 实现。KProbes 重度依赖处理器架构的特定功能,并根据其执行所在的架构使用起来略有不同。下面的讨论仅限于 x86 架构。本文假设你对 x86 架构的中断和异常处理有一定的了解。不过 KProbes 本身在 pc64、x86_64、sparc64 和 i386 架构上均可使用。
内核探针是放置在某个指令地址上的一组处理程序。内核中目前有两种探针,叫做“KProbes”和“JProbes”。KProbe 由一个预处理程序和一个后处理程序定义。当 KProbe 被安置在某条指令处,并且该指令被执行时,预处理程序就在被探测指令执行之前被执行。同理,后处理程序在被探测指令执行后被执行。JProbe 被用于在运行时访问内核函数的参数。JProbe 由一个 JProbe 处理程序定义,其原型与要访问其参数的函数的原型相同。当探测函数被执行时,控制权由用户定义的 JProbe 处理程序接管,随后交还给原函数。KProbes 包就是这样被设计成通过扩展它来打造调试、追踪和日志工具。
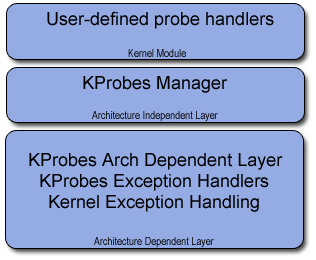
下图描述了 KProbes 的架构。在 x86 上,KProbes 利用异常处理机制,修改标准的断点和其他一些异常处理程序以达到自己的目的。探针大部分工作都是在断点和调试异常处理程序的上下文中完成的,它们构成了 KProbes 架构的依赖层。KProbes 架构的独立层是 KProbes 管理器,用于注册和取消探针。用户在内核模块中提供探针处理程序,通过 KProbes 管理器来注册探针。
KProbes 接口
实现 KProbes 接口的数据结构和函数在 <linux/kprobes.h> 文件中定义。
struct kprobe {
    struct hlist_node hlist;                    /* Internal */
    kprobe_opcode_t addr;                       /* Address of probe */
    kprobe_pre_handler_t pre_handler;           /* Address of pre-handler */
    kprobe_post_handler_t post_handler;         /* Address of post-handler */
    kprobe_fault_handler_t fault_handler;       /* Address of fault handler */
    kprobe_break_handler_t break_handler;       /* Internal */
    kprobe_opcode_t opcode;                     /* Internal */
    kprobe_opcode_t insn[MAX_INSN_SIZE];        /* Internal */
};
我们先看注册 KProbe。用户可以通过编写一个在运行的内核中插入自己的探针,该模块实现了探针的预处理函数和后处理函数。如果在执行探针处理函数时发生故障,用户可以通过定义一个故障处理程序并将其传递到 kprobe 结构中处理故障。这些原型的定义如下。
typedef int (*kprobe_pre_handler_t)(struct kprobe*, struct pt_regs*);
typedef void (*kprobe_post_handler_t)(struct kprobe*, struct pt_regs*,
              unsigned long flags);
typedef int (*kprobe_fault_handler_t)(struct kprobe*, struct pt_regs*,
             int trapnr);
可以看到,预处理程序和后处理程序都会受到探针的引用,以及为探针被命中保存上下文的寄存器。这些值可以在预处理函数和后处理函数中使用,如有需要,也可以在控制权交还给后续指令之前对其进行修改。这也就意味着同一个处理函数可用于多个探针位置。flags 参数目前没有使用。trapnr 参数(用于故障处理函数)包含 KProbe 处理时发生的异常编号。用户定义的故障处理函数可以返回 0,让 KProbe 进一步处理故障。如果它已经处理了故障并想让探针处理程序继续执行,则返回 1。
请注意,目前探针的前处理程序不能为 NULL,尽管后处理函数是可选的。这被认为是个 bug 因为在某些情况下可能只需要后处理程序。在这种情况下用户仍需要定义一个预处理程序。另一个 bug(可能导致内核崩溃)和在 ret/lret 指令中激活的探针相关。还有一个 bug 与 int3 指令上激活的探针相关。所有这些问题应该在 2.6.12 版本的内核中被修复。但是这些 bug 可以很轻易的避免,所以在不打补丁的情况下立即使用 KProbes 问题不大。
KProbe 注册功能定义如下。
int register_kprobe(struct kprobe *p);
int unregister_kprobe(struct kprobe *p);
注册函数获取描述探针的 KProbe 结构的引用。需要注意的是,注册探针的用户模块应保留对该结构的引用,直到探针被解除注册。由于对 KProbe 的访问是序列化的,所以除了在探针处理程序本身的内部(将使系统死锁),探针随时都可以被注册或解除注册。这是因为探针处理程序在拿到用于锁定 KProbes 的自旋锁后执行。在解除注册探针之前,同样会上锁。因此,如果试图在探针处理程序中解除注册探针,将尝试锁定自旋锁两次。
目前,同一地址上不能放置多个探针。但是一个补丁已经提交给了内核邮件列表,它允许通过另一个接口在同一个地址注册多个探针。它可能会被包含在下一个正式版本的内核中。在这之前,如果这样尝试,register_kprobe() 会返回 -EEXIST。
JProbe 用于在运行时提供对函数参数的访问。通过提供一个与被探测函数具有相同原型的 JProbe 处理程序来实现。在运行时,当原始函数被执行时,在复制进程的上下文后控制权移交到 JProbe 处理程序。从 JProbe 处理程序返回时,上下文——由进程的寄存器和堆栈组成——被恢复,因此在 JProbe 处理程序中对进程上下文的任何修改都会丢失。从探针被放置的点开始执行,以原始保存的状态继续。JProbe 用下面的结构表示。
struct jprobe {
    struct kprobe kp;
    kprobe_opcode_t *entry; 	/* user-defined JProbe handler address */
};
用户将处理该探针的函数的地址输入,kprobe 结构中的 addr 字段应设置成要被访问参数的函数地址。下面给出了用于注册和解除注册的 JProbe 函数。
int register_jprobe(struct jprobe *p);
void unregister_jprobe(struct jprobe *p);
用户编写的 JProbe 处理程序在要返回时应该调用 jprobe_return() 而不是 return 语句。
KProbes 管理器
KProbes 管理器负责注册和解除注册 KProbes 和 JProbes。KProbes 管理器在 kernel/kprobes.c 文件中实现。每个探针由 kprobe 结构实现,并存储在由探针地址散列的哈希表中。对这个哈希表的访问由自旋锁 kprobe_lock 序列化。在注册新探针、取消现有探针或命中探针之前,都会上锁。这样防止这些操作在 SMP 机器上同时执行。每当命中探针,处理程序都会被调用,中断被禁用。之所以要禁用中断是因为处理探针是一个多步骤的过程,其中包括断点处理和探针指令的单步执行。保存这些操作之间的状态很困难,因此在探针处理过程中,中断被禁止。
管理器由这些功能组成,下面是对它们用途的简单描述。这些函数独立于架构,逐行阅读 kernel/prokbes.c 中的代码和这些步骤就清楚整个实现过程了。
void lock_kprobes(void)
给 KProbes 上锁并记录被锁的 CPU。
void unlock_kprobes(void)
重置被记录的 CPU 并解锁 KProbes。
struct kprobe *get_kprobe(void *addr)
使用探针指令的地址,从哈希表返回探针。
int register_kprobe(struct kprobe *p)
这个函数在给定地址注册一个探针。注册包括将在探针地址的指令复制到探针特定的缓冲区中。x86 上指令最大 16 字节,因此在给定的地址上复制 16 字节。然后用断点指令来替换探针地址的指令。
void unregister_kprobe(struct kprobe *p)
这个函数对探针解除注册。它恢复地址处的原始指令,并从哈希表中删除探针结构。
int register_jprobe(struct jprobe *jp)
这个函数在被访问函数地址注册了一个 JProbe。JProbes 使用 KProbes 机制。在 KProbe
pre_handler中存储了自己的处理程序setjmp_pre_handler,在break_handler中存储了longjmp_break_handler的地址,然后通过调用register_kprobe()注册jp->kpkprobe 结构。
void unregister_jprobe(struct jprobe *jp)
对这个 JProbe 使用的 kprobe 结构解除注册
KProbe 命中时会发生什么?
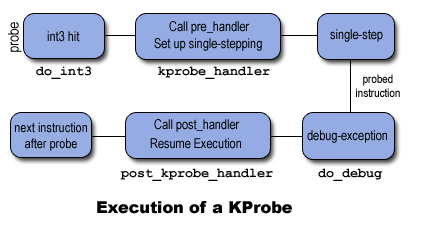
处理探针的步骤和架构相关;它们由 arch/i386/kernel/probes.c 文件中定义的函数处理。在探针被注册后,它们处于激活状态的地址包含断点指令(x86 上的 int3)。一旦执行到探针地址,int3 指令就会被执行,于是控制权递交至 arch/i386/kernel/traps.c 中的断点处理程序 do_int3()。do_int3() 是由中断调用的,当程序执行到那里时中断被禁止。该处理程序通知 KProbes 到达了断点;KProbes 检查断点是否由 KProbes 的注册程序设置。如果被命中的地址上没有探针,就简单返回个 0,反之调用注册的探针函数。
JProbe 命中时又会发生什么?
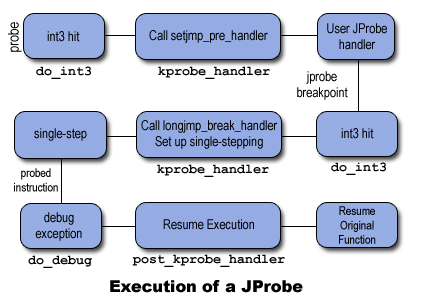
JProbe 必须将控制权递交至另一个函数上,而这个函数的原型与放置探针的函数相同,然后将控制权交还原函数,就行 JProbe 执行前那样。JProbe 利用了 KProbe 的机制。JProbe 指定自己的预处理程序 setjmp_pre_handler() 而不是用户定义的预处理程序,并使用另外一个叫做 break_handler 的处理程序。这是一个三步走的过程。
第一步,当命中断点时,执行至 kprobe_handler(),调用 JProbe 预处理程序(setjmp_pre_handler())。在修改 eip 为用户定义的函数地址前将保存堆栈内容和寄存器,然后返回 1 告诉 kprobe_handler() 简单返回就行了,不用像 KProbe 那样设置单个步骤。当用户定义的函数执行完后,它调用 jprobe_return() 而不是正常返回。
第二步 jprobe_return() 截断当前堆栈帧并生成一个断点,通过 do_int3() 将控制权递交至 kprobe_handler()。kprobe_handler() 发现生成的断点地址(jprobe_handler() 中 int3 指令的地址)并没有探针注册,但是 KProbes 在当前 CPU 上是激活的。它认为断点一定是由 JProbe 生成的,因此调用之前保存的 current_kprobe 的 break_handler。break_handler 恢复堆栈内容和将控制权移交至用户定义函数之前保存的寄存器,并返回。
第三步 kprobe_handler() 对设置 JProbe 的指定进行单步操作,其余序列与 KProbe 相同。
可能存在的问题
当 KProbes 处理一个探针时,可能出现一些问题。第一种可能是在同一个 SMP 系统中并行处理多个探针。但是在这个案例中有一个所有探针共享的公共哈希表,需要保护它不被破坏。在这种情况下,kprobe_lock 将不同处理器的探针序列化。
另一个问题是,如果将探针放置在 KProbes 代码里面,会导致 KProbes 递归进入探针处理代码。这个问题在 kprobe_handler() 得到了处理,通过检查 KProbes 是否已在当前 CPU 上运行。在这种情况下递归的探针会被静默地禁止,控制权交还之前的探针处理代码。
如果在 KProbes 执行时发生竞争,它可以在处理一个探针时上下文切换到另一个进程。另一个进程可能会导致另一个探针走火,这将导致控制再次到达 kprobe_handler(),而前一个探针未被处理完全。这可能会导致当 KProbes 发现不断出现新的探针,会接触它的控制。为了避免这个问题,处理探针时禁用抢占。
同样,断点处理程序和调试程序通过中断而不是陷阱门触发来禁用中断。这样一来只要控制权递交至断点或调试处理程序就会禁用中断。这些修改在 arch/i386/kernel/traps.c 中体现。
在处理探针期间可能会出错。在这种情况下,如果用户为探针定义了错误处理程序,控制权就会递交至错误处理程序。如果用户定义的错误处理程序返回 0,错误就由内核来处理。否则控制权在错误处理程序处理完错误后交还探针处理程序。
总结
KProbes 是一款非常棒的调试与追踪工具;也可以用于性能测算。开发者可以用它来在内核里追踪他们的程序以达到调试的目的。系统管理员可以用它来追踪生产系统上内核的事件。KProbes 也可以用于非关键性能测算。但是当前的 KProbes 实现在处理探针时引入了一些自己的延迟。导致这种延迟的原因就是单一的 kprobe_lock,它将序列化 SMP 机器上所有 CPU 的探针执行。另一个原因是 KProbes 使用的机制,它使用多个异常来处理一个探针。异常处理的开销极大,会造成自身的延迟。需要在这方面下功夫,提高 SMP 的可扩展性,改善探针处理时间,使 KProbes 成为可用的性能测算工具。
但是 KProbes 不能直接用于这些目的。更原始地,用户可以编写一个内核模块来实现探针处理程序。然而,更高层次的更易于使用的工具是有必要的,这些工具可以包含标准的探针处理程序,实现所需的功能,或者它们可以生成探针处理程序,用脚本语言进行简单的描述,就像 DProbes 那样。
原文
Introduction
KProbes is a debugging mechanism for the Linux kernel which can also be used for monitoring events inside a production system. You can use it to weed out performance bottlenecks, log specific events, trace problems etc. KProbes was developed by IBM as an underlying mechanism for another higher level tracing tool called DProbes. DProbes adds a number of features, including its own scripting language for the writing of probe handlers. However, only KProbes has been merged into the standard kernel.
In this article I will describe the implementation of KProbes as present in the 2.6.11.7 kernel. KProbes heavily depends on processor architecture specific features and uses slightly different mechanisms depending on the architecture on which it’s being executed. The following discussion pertains only to the x86 architecture. This article assumes a certain familiarity with the x86 architecture regarding interrupts and exceptions handling. KProbes is available on the following architectures however: ppc64, x86_64, sparc64 and i386.
A kernel probe is a set of handlers placed on a certain instruction address. There are two types of probes in the kernel as of now, called “KProbes” and “JProbes.” A KProbe is defined by a pre-handler and a post-handler. When a KProbe is installed at a particular instruction and that instruction is executed, the pre-handler is executed just before the execution of the probed instruction. Similarly, the post-handler is executed just after the execution of the probed instruction. JProbes are used to get access to a kernel function’s arguments at runtime. A JProbe is defined by a JProbe handler with the same prototype as that of the function whose arguments are to be accessed. When the probed function is executed the control is first transferred to the user-defined JProbe handler, followed by the transfer of execution to the original function. The KProbes package has been designed in such a way that tools for debugging, tracing and logging could be built by extending it.
The figure to the right describes the architecture of KProbes. On the x86, KProbes makes use of the exception handling mechanisms and modifies the standard breakpoint, debug and a few other exception handlers for its own purpose. Most of the handling of the probes is done in the context of the breakpoint and the debug exception handlers which make up the KProbes architecture dependent layer. The KProbes architecture independent layer is the KProbes manager which is used to register and unregister probes. Users provide probe handlers in kernel modules which register probes through the KProbes manager.
KProbes Interface
The data structures and functions implementing the KProbes interface have been defined in the file <linux/kprobes.h>. The following data structure describes a KProbe.
struct kprobe {
    struct hlist_node hlist;                    /* Internal */
    kprobe_opcode_t addr;                       /* Address of probe */
    kprobe_pre_handler_t pre_handler;           /* Address of pre-handler */
    kprobe_post_handler_t post_handler;         /* Address of post-handler */
    kprobe_fault_handler_t fault_handler;       /* Address of fault handler */
    kprobe_break_handler_t break_handler;       /* Internal */
    kprobe_opcode_t opcode;                     /* Internal */
    kprobe_opcode_t insn[MAX_INSN_SIZE];        /* Internal */
};
Let’s first talk about registering a KProbe. Users can insert their own probe inside a running kernel by writing a kernel module which implements the pre-handler and the post-handler for the probe. In case a fault occurs while executing a probe handler function, the user can handle the fault by defining a fault-handler and passing its address in struct kprobe. The prototypes for these are defined as below.
typedef int (*kprobe_pre_handler_t)(struct kprobe*, struct pt_regs*);
typedef void (*kprobe_post_handler_t)(struct kprobe*, struct pt_regs*,
              unsigned long flags);
typedef int (*kprobe_fault_handler_t)(struct kprobe*, struct pt_regs*,
             int trapnr);
As can be seen the pre-handler and the post-handler both receive a reference to the probe as well as the registers saved for the context in which the probe was hit. These values can be used in the pre-handler or post-handler or if required, they can be modified before returning control to the subsequent instruction. This also means that the same handlers can be used for multiple probe locations. The flags parameter is currently unused. The trapnr parameter (for the fault handler function) contains the exception number which occurred while handling the KProbe. A user defined fault handler can return 0 to let KProbe handle the fault further. It returns 1 if it has handled the fault and wants to let the execution of the probe handler continue.
Note that currently the pre-handler cannot be NULL for a probe, although the use of post-handler is optional. This is considered a bug since there may be cases where the pre-handler may not be required but a post-handler is needed. In such situations the user will still have to define a pre-handler. Another bug (which can oops the kernel) is related to probes which are activated on the ret/lret instructions. Yet another bug is related to probes activated on int3 instructions. All of these problems should be fixed in the 2.6.12 release of the kernel. However, these bugs can be easily avoided so they do not present any serious issues for someone who wants to use KProbes immediately without applying patches.
The KProbe registration functions are defined as shown below.
int register_kprobe(struct kprobe *p);
int unregister_kprobe(struct kprobe *p);
The registration function takes a reference to the KProbe structure describing the probe. Note that the user’s module which registers the probe should keep a reference to the structure until the probe is unregistered. Since access to KProbes is serialized, a probe can be registered or unregistered anytime except from inside the probe handlers themselves, which will deadlock the system. This is because probe handlers execute after the spinlock used for locking KProbes has been acquired. The same spinlock is locked just before unregistering the probe. So if an attempt is made to unregister a probe inside a probe handler the same path will try to lock the spinlock twice.
Multiple probes cannot be placed on the same address as of now. However, a patch has been submitted to the kernel mailing list which allows multiple probes to be registered at the same address through another interface. It might be included in the next release of the kernel. Until then, if such an attempt is made register_kprobe() returns -EEXIST.
JProbes are used to give access to a function’s arguments at runtime. This is achieved by providing a JProbe handler with the same prototype as that of the function being probed. At runtime, when the original function is executed, control is transferred to the JProbe handler after copying the process’s context. On return from the JProbe handler, the context - consisting of the process’s registers and the stack - is restored, so any modifications to the context of the process in the JProbe handler are lost. The execution continues from the point at which the probe was placed with the original saved state. A JProbe is represented by the structure given below.
struct jprobe {
    struct kprobe kp;
    kprobe_opcode_t *entry; 	/* user-defined JProbe handler address */
};
The user places the address of the function which will handle this probe in the entry field. The addr field in struct kprobe should be populated with the address of the function whose arguments are to be accessed. The functions used to register and unregister a JProbe are given below.
int register_jprobe(struct jprobe *p);
void unregister_jprobe(struct jprobe *p);
The JProbe handler which is written by the user should call jprobe_return() when it wants to return instead of the return statement.
KProbes Manager
The KProbes Manager is responsible for registering and unregistering KProbes and JProbes. The file kernel/kprobes.c implements the KProbes manager. Each probe is described by the struct kprobe structure and stored in a hash table hashed by the address at which the probe is placed. Access to this hash table is serialized by the spinlock kprobe_lock. This spinlock is locked before a new probe is registered, an existing probe is unregistered or when a probe is hit. This prevents these operations from executing simultaneously on a SMP machine. Whenever a probe is hit, the probe handler is called with interrupts disabled. Interrupts are disabled because handling a probe is a multiple step process which involves breakpoint handling and single-step execution of the probed instruction. There is no easy way to save the state between these operations hence interrupts are kept disabled during probe handling.
The manager is composed of these functions which are followed by a simplified description of what they do. These functions are architecture independent. A side-by-side reading of the code in kernel/kprobes.c and these steps will clarify the whole implementation.
void lock_kprobes(void)
Locks KProbes and records the CPU on which it was locked
void unlock_kprobes(void)
Resets the recorded CPU and unlocks KProbes
struct kprobe *get_kprobe(void *addr)
Using the address of the probed instruction, returns the probe from hash table
int register_kprobe(struct kprobe *p)
This function registers a probe at a given address. Registration involves copying the instruction at the probe address in a probe specific buffer. On x86 the maximum instruction size is 16 bytes hence 16 bytes are copied at the given address. Then it replaces the instruction at the probed address with the breakpoint instruction.
void unregister_kprobe(struct kprobe *p)
This function unregisters a probe. It restores the original instruction at the address and removes the probe structure from the hash table.
int register_jprobe(struct jprobe *jp)
This function registers a JProbe at a function address. JProbes use the KProbes mechanism. In the KProbe
pre_handlerit stores its own handlersetjmp_pre_handlerand in thebreak_handlerstores the address oflongjmp_break_handler. Then it registers struct kprobejp->kpby callingregister_kprobe()
void unregister_jprobe(struct jprobe *jp)
Unregisters the struct kprobe used by this JProbe
What happens when a KProbe is hit?
The steps involved in handling a probe are architecture dependent; they are handled by the functions defined in the file arch/i386/kernel/kprobes.c. After the probes are registered, the addresses at which they are active contain the breakpoint instruction (int3 on x86). As soon as execution reaches a probed address the int3 instruction is executed, causing the control to reach the breakpoint handler do_int3() in arch/i386/kernel/traps.c. do_int3() is called through an interrupt gate therefore interrupts are disabled when control reaches there. This handler notifies KProbes that a breakpoint occurred; KProbes checks if the breakpoint was set by the registration function of KProbes. If no probe is present at the address at which the probe was hit it simply returns 0. Otherwise the registered probe function is called.
What happens when a JProbe is hit?
A JProbe has to transfer control to another function which has the same prototype as the function on which the probe was placed and then give back control to the original function with the same state as there was before the JProbe was executed. A JProbe leverages the mechanism used by a KProbe. Instead of calling a user-defined pre-handler a JProbe specifies its own pre-handler called setjmp_pre_handler() and uses another handler called a break_handler. This is a three-step process.
In the first step, when the breakpoint is hit control reaches kprobe_handler() which calls the JProbe pre-handler (setjmp_pre_handler()). This saves the stack contents and the registers before changing the eip to the address of the user-defined function. Then it returns 1 which tells kprobe_handler() to simply return instead of setting up single-stepping as for a KProbe. On return control reaches the user-defined function to access the arguments of the original function. When the user defined function is done it calls jprobe_return() instead of doing a normal return.
In the second step jprobe_return() truncates the current stack frame and generates a breakpoint which transfers control to kprobe_handler() through do_int3(). kprobe_handler() finds that the generated breakpoint address (address of int3 instruction in jprobe_handler()) does not have a registered probe however KProbes is active on the current CPU. It assumes that the breakpoint must have been generated by JProbes and hence calls the break_handler of the current_kprobe which it saved earlier. The break_handler restores the stack contents and the registers that were saved before transferring control to the user-defined function and returns.
In the third step kprobe_handler() then sets up single-stepping of the instruction at which the JProbe was set and the rest of the sequence is the same as that of a KProbe.
Possible problems
There could be several possible problems which could occur when a probe is handled by KProbes. The first possibility is that several probes are handled in parallel on a SMP system. However, there’s a common hash table shared by all probes which needs to be protected against corruption in such a case. In this case kprobe_lock serializes the probe handling across processors.
Another problem occurs if a probe is placed inside KProbes code, causing KProbes to enter probe handling code recursively. This problem is taken care of in kprobe_handler() by checking if KProbes is already running on the current CPU. In this case the recursing probe is disabled silently and control returns back to the previous probe handling code.
If preemption occurs when KProbes is executing it can context switch to another process while a probe is being handled. The other process could cause another probe to fire which will cause control to reach kprobe_handler() again while the previous probe was not handled completely. This may result in disarming the new probe when KProbes discovers it’s recursing. To avoid this problem, preemption is disabled when probes are handled.
Similarly, interrupts are disabled by causing the breakpoint handler and the debug handler to be invoked through interrupt gates rather than trap gates. This disables interrupts as soon as control is transferred to the breakpoint or debug handler. These changes are made in the file arch/i386/kernel/traps.c.
A fault might occur during the handling of a probe. In this case, if the user has defined a fault handler for the probe, control is transferred to the fault handler. If the user-defined fault handler returns 0 the fault is handled by the kernel. Otherwise, it’s assumed that the fault was handled by the fault handler and control reaches back to the probe handlers.
Conclusion
KProbes is an excellent tool for debugging and tracing; it can also be used for performance measuring. Developers can use it to trace the path of their programs inside the kernel for debugging purposes. System administrators can use it to trace events inside the kernel on production systems. KProbes can also be used for non-critical performance measurements. The current KProbes implementation, however, introduces some latency of its own in handling probes. The cause behind this latency is the single kprobe_lock which serializes the execution of probes across all CPUs on a SMP machine. Another reason is the mechanism used by KProbes which uses multiple exceptions to handle a single probe. Exception handling is an expensive operation which causes its own delays. Work needs to be done in this area to improve SMP scalability and improving the probe handling time to make KProbes a viable performance measuring tool.
KProbes however cannot be used directly for these purposes. In the raw form a user can write a kernel module implementing the probe handlers. However higher level tools are necessary for making it more convenient to use. Such tools could contain standard probe handlers implementing the desired features or they could contain a means to produce probe-handlers given simple descriptions of them in a scripting language like DProbes.