GPFS 数据加载缓慢排查
May 12, 2026 00:00 · 2792 words · 6 minute read
一句话描述问题现象:在跑模型训练时,数据集初始化(从 GPFS 加载数据)阶段非常耗时,NCCL 超时时间设置 60min 都不够。
排查
代码排查
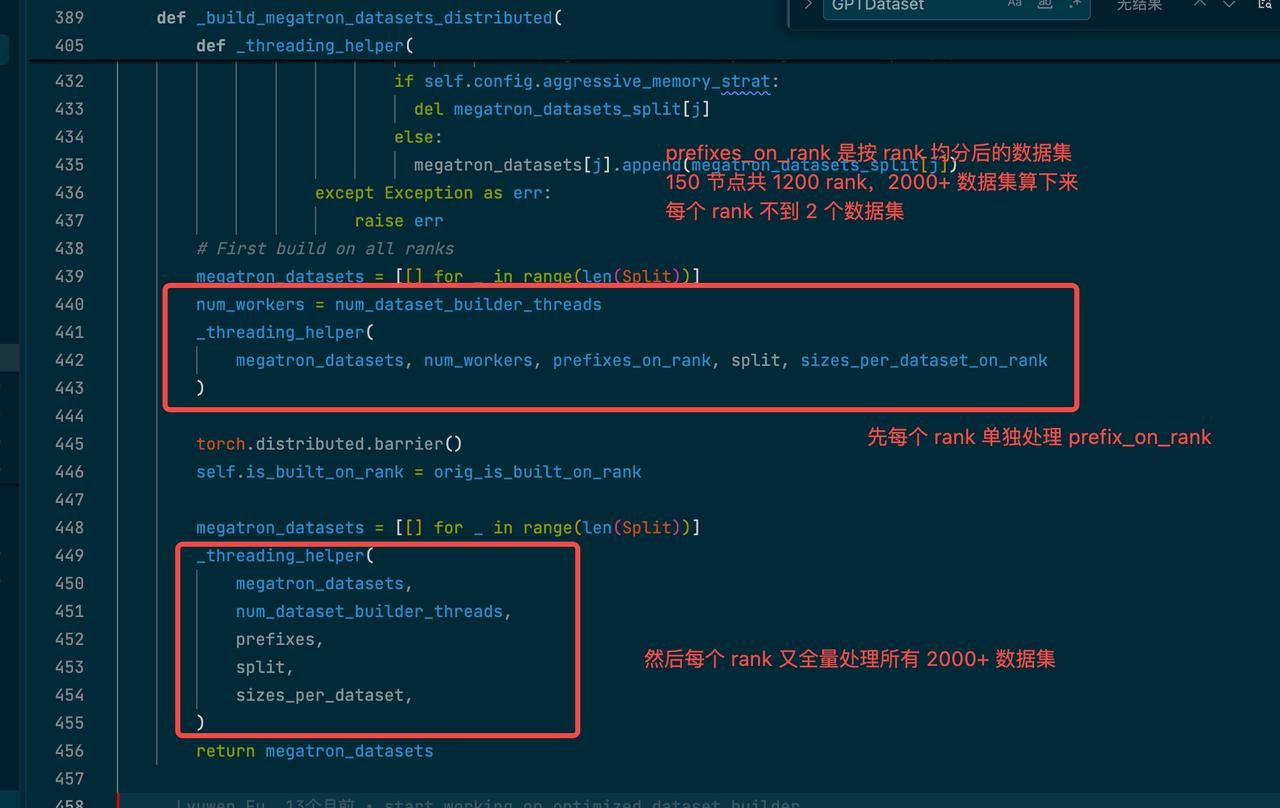
首先排查了用户的代码,有 2200 多个数据集 12.8T 数据,训练任务使用 150 节点,即 1200 卡。
初始化时每个 rank 都会全量初始化所有数据集:
每个数据的初始化都会调用 GPTDataset 中的 build_low_level_dataset,该方法会根据参数 config.mmap_bin_files 选择是否创建 mmap buffer。
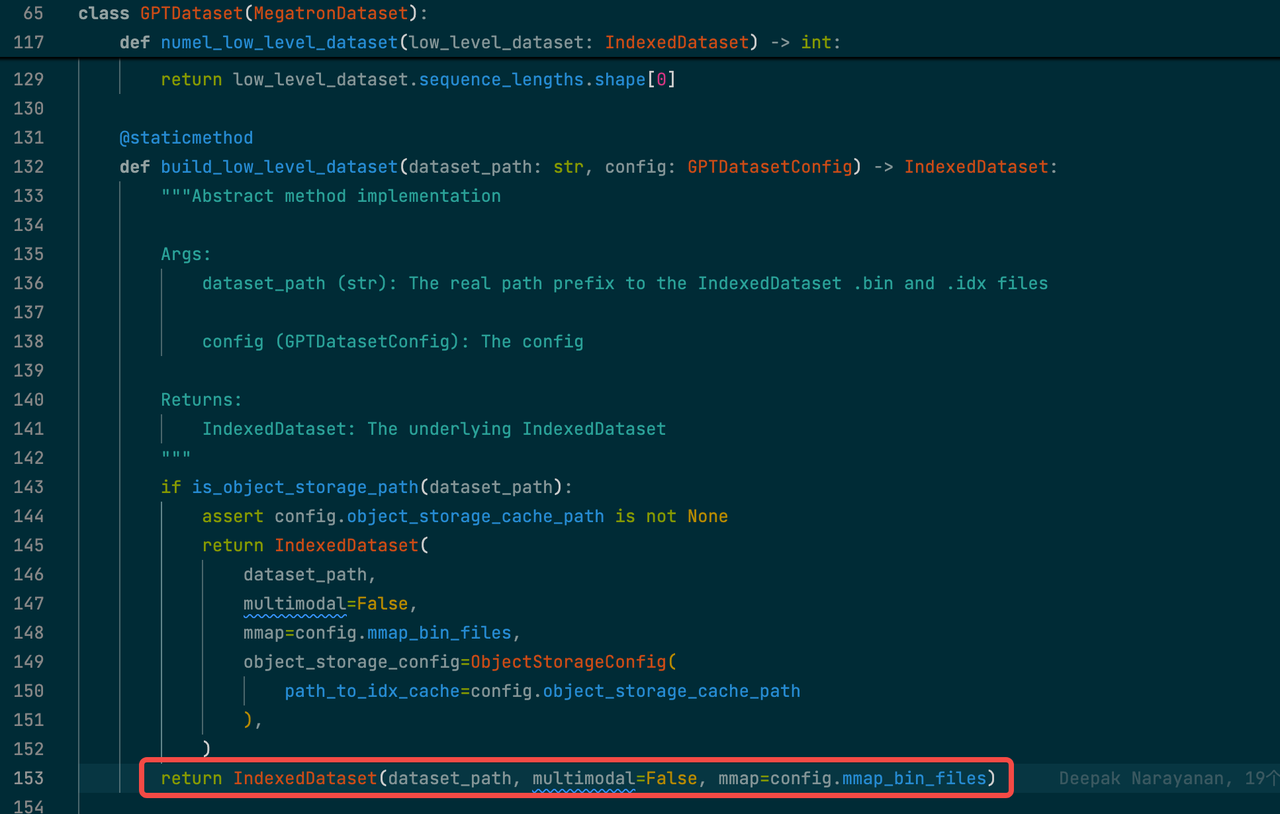
如果是 mmap 则创建 mmap buffer 后返回,否则直接赋值数据集路径 bin_path 就返回:
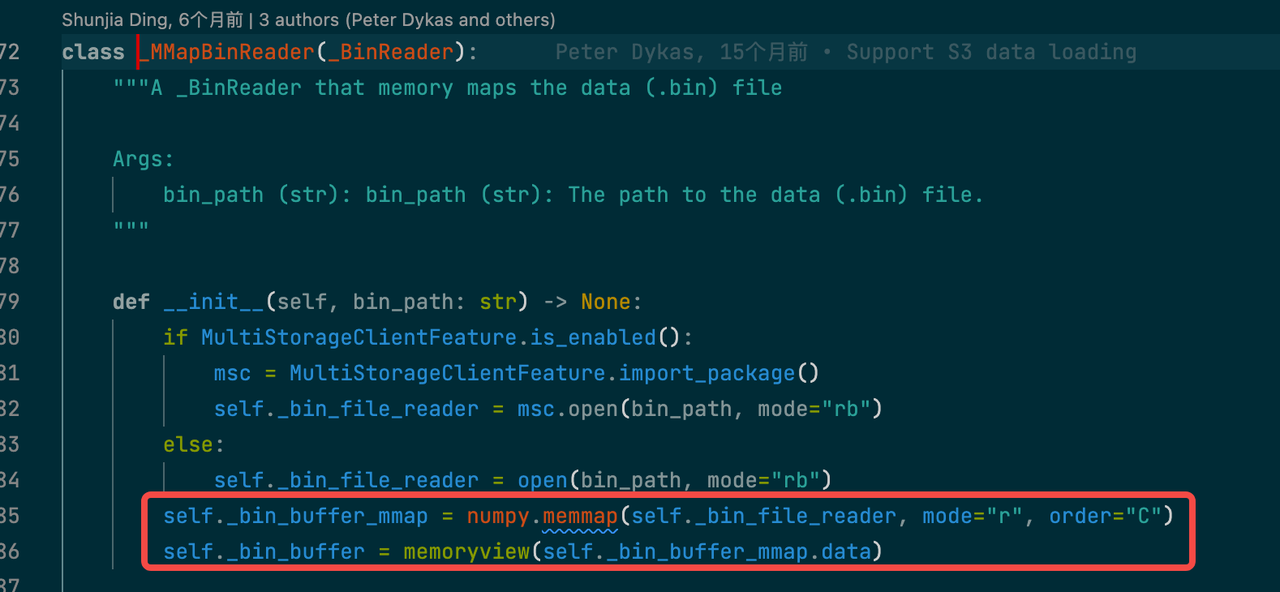
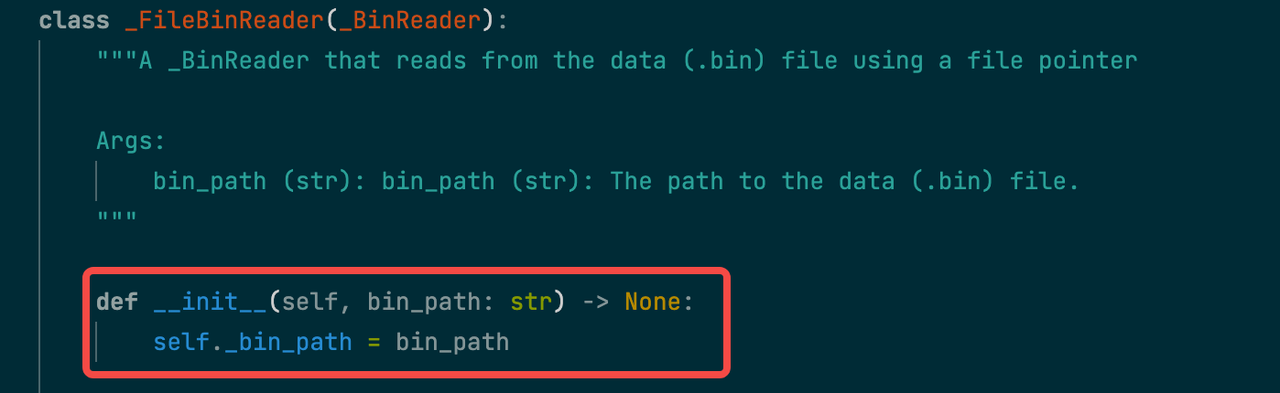
所以数据集初始化阶段如果不开启 mmap 就没有任何开销,理论上几秒钟应该就完事。
因此先以 mmap buffer 为排查方向。
-
关闭 mmap buffer
为排除 mmap buffer 的影响,我们关闭了 mmap buffer,看代码中已经生效:

然而实际情况还是很慢,说明不是 mmap buffer 创建造成的影响。
-
数据集 idx 加载
除了记录数据集文件位置外,还需要读取数据集 idx 目录,包括
sequence_lengths,sequence_pointers和document_indices。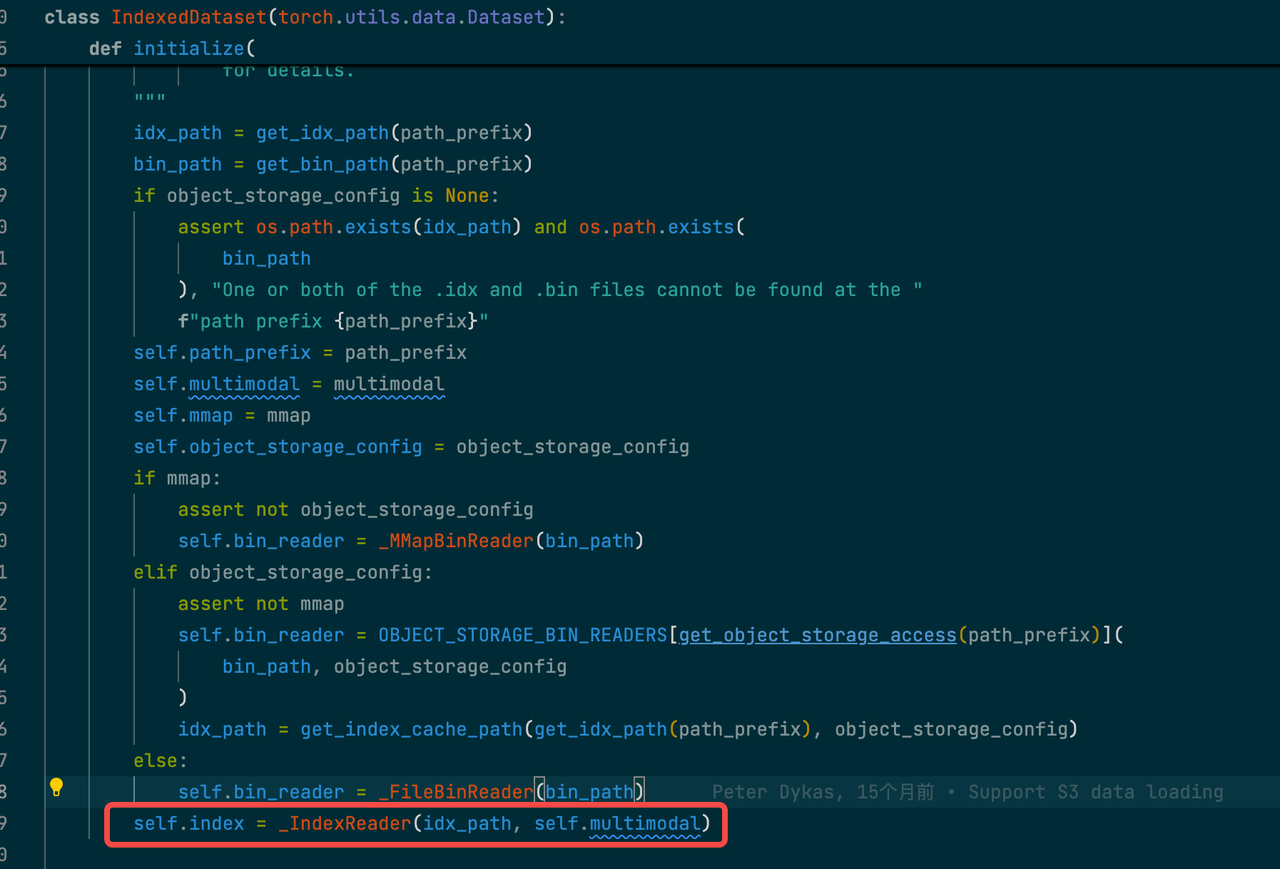
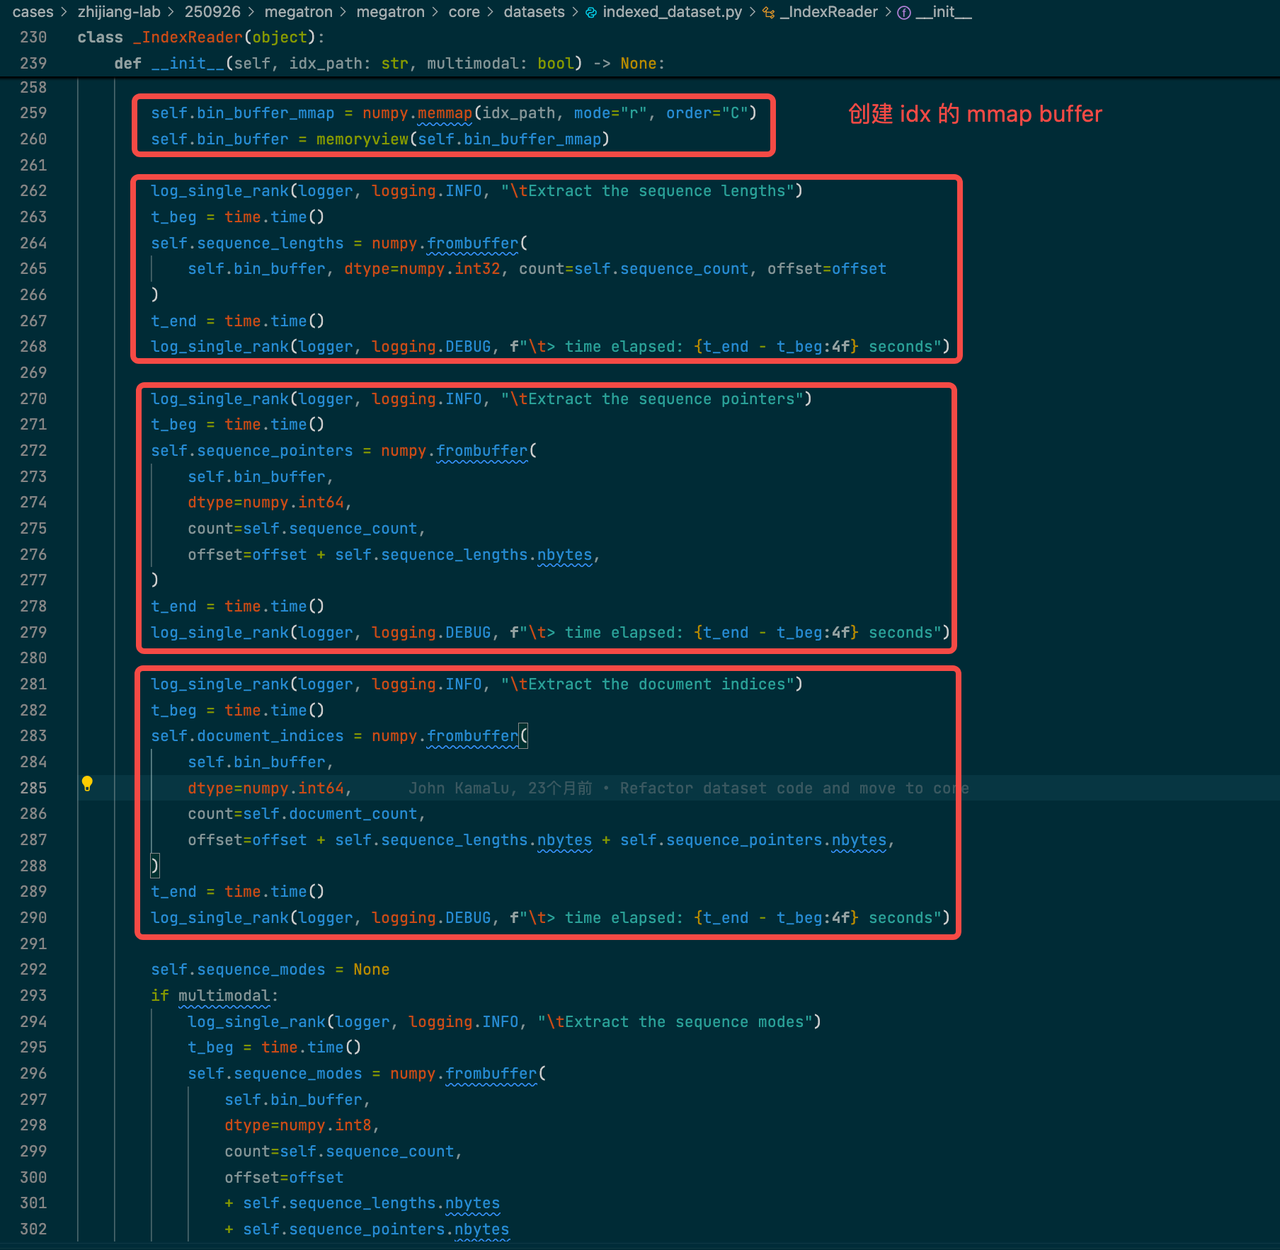
这部分 idx 数据量总共应该在 200GB 左右,理论上几分钟应该就可以加载完。
系统排查
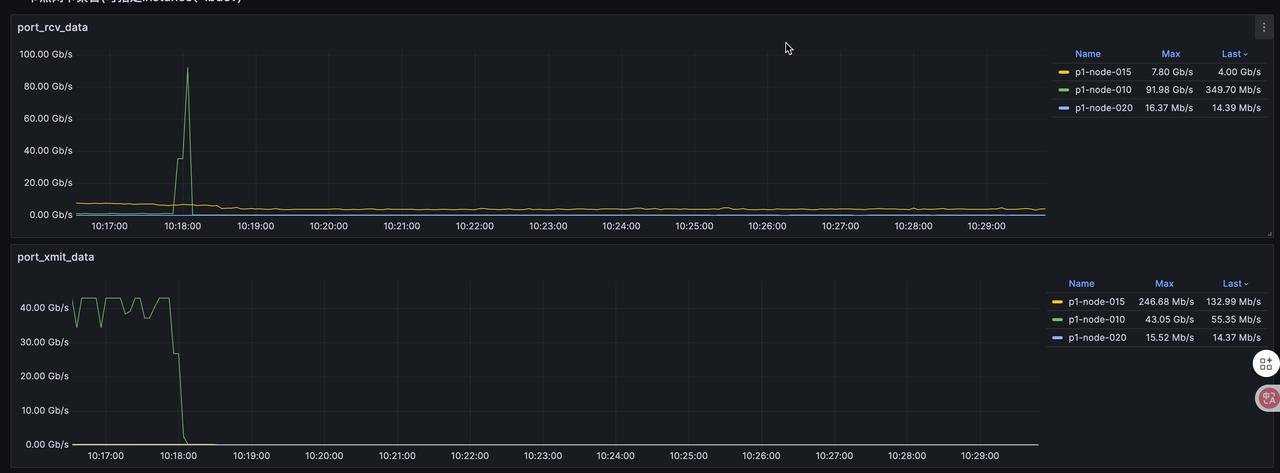
存储流量的监控看起来都没啥问题,流量都不大。
先确认几个非常缓慢的具有代表性的 worker Pod,到相应的节点上找出容器 1 号进程 pid,查看其进程树:
$ crictl inspect 7835f3f172988cceaf3daec47fb7538b90818f711b780330817206ed680c295f | jq .info.pid
1688251

$ pstree -T -p 1688251
tini(1688251)-+-bash(1731957)---pt_elastic(1731980)-+-python(1732481)---python(1734497)-+-pyt+
              |                                     |                                   |-pyt+
              |                                     |                                   |-pyt+
              |                                     |                                   |-pyt+
              |                                     |                                   |-pyt+
              |                                     |                                   |-pyt+
              |                                     |                                   |-pyt+
              |                                     |                                   |-pyt+
              |                                     |                                   `-pyt+
              |                                     |-python(1732483)---python(1734528)-+-pyt+
              |                                     |                                   |-pyt+
              |                                     |                                   |-pyt+
              |                                     |                                   |-pyt+
              |                                     |                                   |-pyt+
              |                                     |                                   `-pyt+
              |                                     |-python(1732492)---python(1734451)-+-pyt+
              |                                     |                                   |-pyt+
              |                                     |                                   |-pyt+
              |                                     |                                   |-pyt+
              |                                     |                                   `-pyt+
              |                                     |-python(1732499)---python(1734537)-+-pyt+
              |                                     |                                   |-pyt+
              |                                     |                                   |-pyt+
              |                                     |                                   |-pyt+
              |                                     |                                   `-pyt+
              |                                     |-python(1732507)---python(1734499)-+-pyt+
              |                                     |                                   |-pyt+
              |                                     |                                   |-pyt+
              |                                     |                                   |-pyt+
              |                                     |                                   |-pyt+
              |                                     |                                   |-pyt+
              |                                     |                                   `-pyt+
              |                                     |-python(1732512)---python(1734478)-+-pyt+
              |                                     |                                   |-pyt+
              |                                     |                                   |-pyt+
              |                                     |                                   |-pyt+
              |                                     |                                   |-pyt+
              |                                     |                                   |-pyt+
              |                                     |                                   |-pyt+
              |                                     |                                   `-pyt+
              |                                     |-python(1732518)---python(1734546)-+-pyt+
              |                                     |                                   |-pyt+
              |                                     |                                   |-pyt+
              |                                     |                                   |-pyt+
              |                                     |                                   |-pyt+
              |                                     |                                   |-pyt+
              |                                     |                                   `-pyt+
              |                                     `-python(1732525)---python(1734496)-+-pyt+
              |                                                                         |-pyt+
              |                                                                         |-pyt+
              |                                                                         |-pyt+
              |                                                                         |-pyt+
              |                                                                         |-pyt+
              |                                                                         |-pyt+
              |                                                                         `-pyt+
              |-python3(1714968)
              |-python3(1722122)
因为进程数量非常多,不可能全看,选取一个可能为 rank 的查看其 CPU 使用率:
pidstat -u -p 1732507 1
Linux 5.15.0-88-generic (P4-Node-020)         09/29/25         _x86_64_        (192 CPU)

10:22:01      UID       PID    %usr %system  %guest   %wait    %CPU   CPU  Command
10:22:02        0   1732507    0.00  100.00    0.00    0.00  100.00    47  python
10:22:03        0   1732507    0.00  101.00    0.00    0.00  101.00    47  python
10:22:04        0   1732507    0.00  100.00    0.00    0.00  100.00    47  python
10:22:05        0   1732507    0.00  100.00    0.00    0.00  100.00    47  python
10:22:06        0   1732507    0.00  100.00    0.00    0.00  100.00    47  python
10:22:07        0   1732507    0.00  100.00    0.00    0.00  100.00    47  python
进程 PID 1732507 使用了 CPU 的 47 核心,使用率达到了百分百,系统态 CPU 使用率百分百,说明进程做的某些系统调用有问题。
用 perf top 采样 PID 1732507 perf top -p 1732507
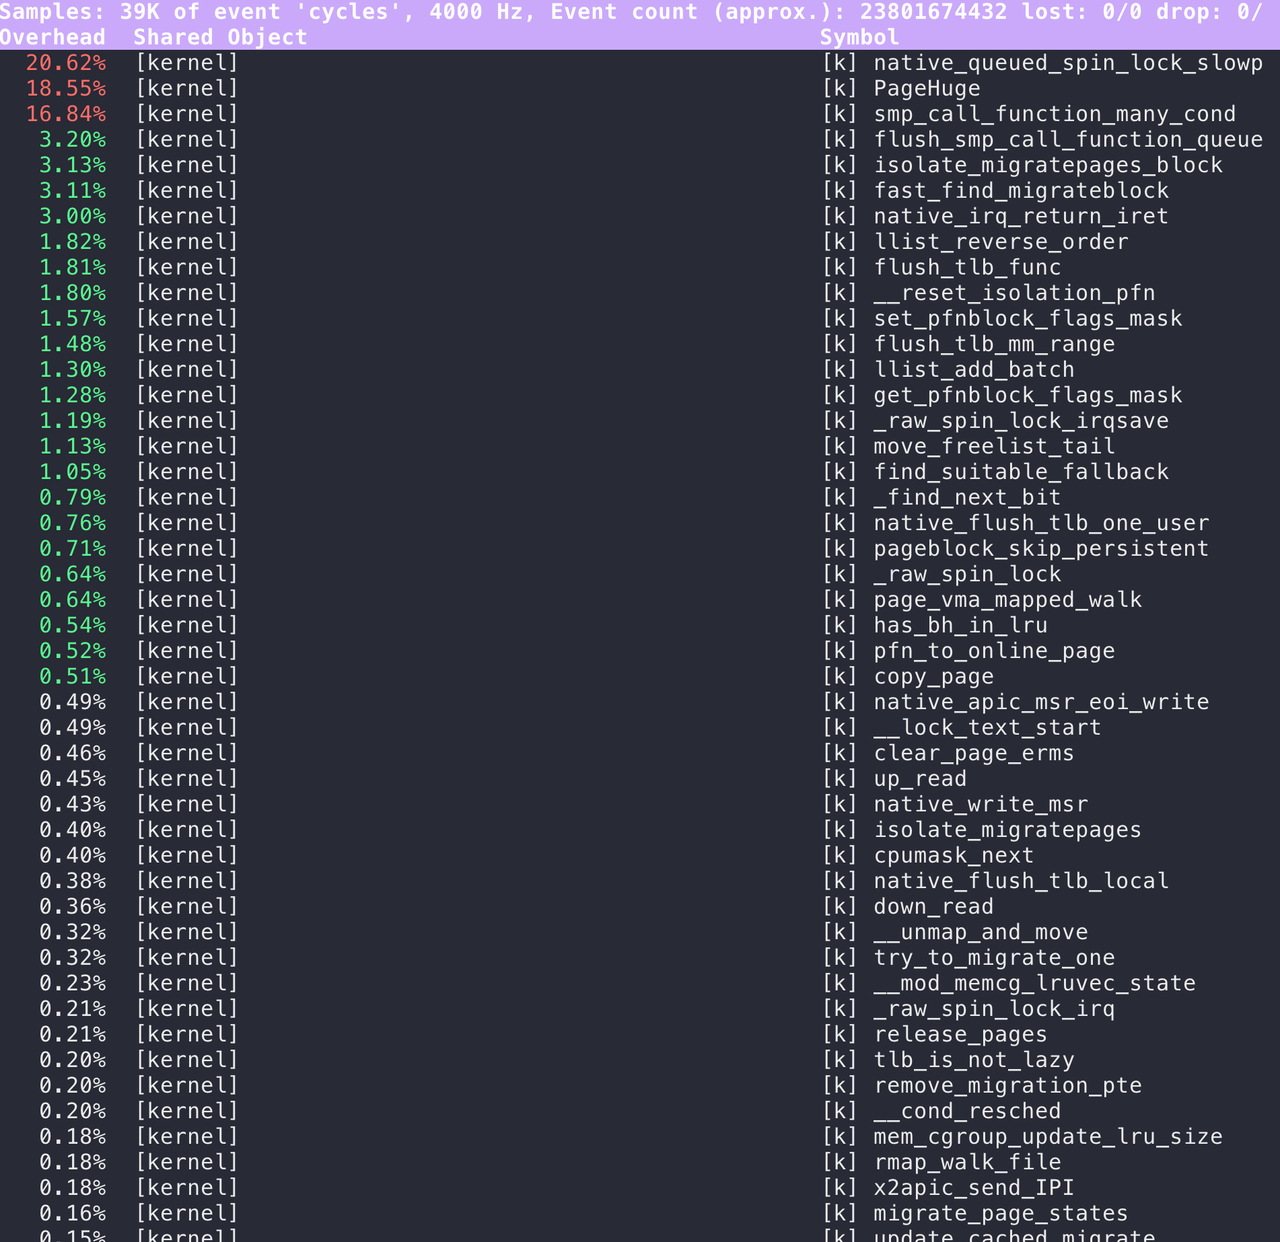
- PageHuge(内核)
- native_queued_spin_lock_slowpath.part.0(内核)
- smp_call_function_many_cond(内核)
这三处函数使用了非常多的 CPU(其实此时已经可以拿去 Google 一下了)
继续采样 PID 1732507:
perf record -g -p 1732507 # 需要采样几十秒
查看 CPU 采样报告:
perf report -n --stdio
# To display the perf.data header info, please use --header/--header-only options.
#
#
# Total Lost Samples: 0
#
# Samples: 166K of event 'cycles'
# Event count (approx.): 127268554869
#
# Children      Self       Samples  Command          Shared Object                                        Symbol
# ........  ........  ............  ...............  ...................................................  ...........................................................
#
    99.77%     0.14%           231  python           _multiarray_umath.cpython-312-x86_64-linux-gnu.so    [.] INT_fill
            |
             --99.69%--INT_fill
                       |
                        --99.56%--asm_exc_page_fault
                                  |
                                   --99.54%--exc_page_fault
                                             |
                                              --99.46%--do_user_addr_fault
                                                        |
                                                         --99.45%--handle_mm_fault
                                                                   |
                                                                    --99.44%--__handle_mm_fault
                                                                              |
                                                                               --99.14%--do_huge_pmd_anonymous_page
                                                                                         alloc_pages_vma
                                                                                         __alloc_pages
                                                                                         |
                                                                                          --99.14%--__alloc_pages_slowpath.constprop.0
                                                                                                    |
                                                                                                    |--98.32%--__alloc_pages_direct_compact
                                                                                                    |          |
                                                                                                    |           --98.32%--try_to_compact_pages
                                                                                                    |                     |
                                                                                                    |                      --98.32%--compact_zone_order
                                                                                                    |                                |
                                                                                                    |                                 --98.30%--compact_zone
                                                                                                    |                                           |
                                                                                                    |                                           |--53.81%--isolate_migratepages
                                                                                                    |                                           |          |
                                                                                                    |                                           |          |--25.77%--fast_find_migrateblock
                                                                                                    |                                           |          |          |
                                                                                                    |                                           |          |          |--18.60%--_raw_spin_lock_irqsave
                                                                                                    |                                           |          |          |          |
                                                                                                    |                                           |          |          |           --17.74%--native_queued_spin_lock_slowpath
                                                                                                    |                                           |          |          |                     |
                                                                                                    |                                           |          |          |                      --17.74%--native_queued_spin_lock_slowpath.part.0
                                                                                                    |                                           |          |          |
                                                                                                    |                                           |          |          |--1.72%--__lock_text_start
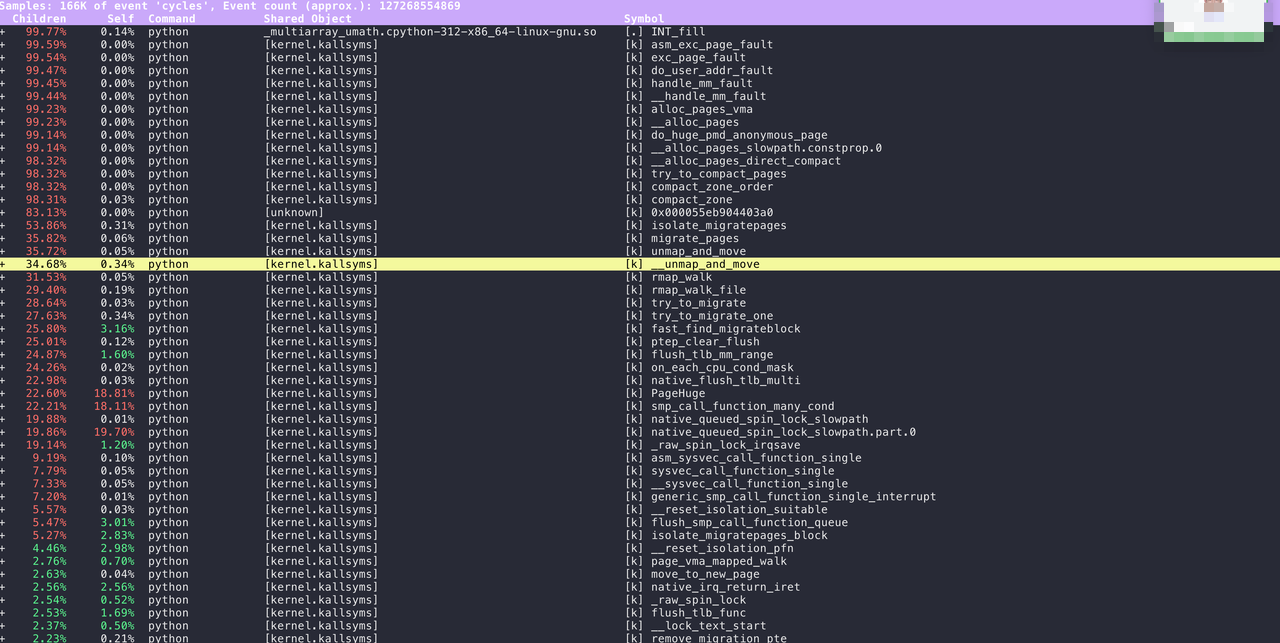
分析
将上图交给 ChatGPT 分析,说是透明大页(THP)和 NUMA balancing 的问题:
这是 perf top 在采样 CPU cycles 的截图,显示你的 Python 进程绝大多数时间耗在内核的内存分配路径。具体是透明大页(THP, transparent huge pages)相关的匿名页缺页处理与内存压缩/迁移。
- 左侧 Command 基本都是 python,Shared Object 是 [kernel.kallsyms],说明 CPU 时间在内核而不是用户态代码。
- 右侧调用栈包含 handle_mm_fault、alloc_pages_vma、do_huge_pmd_anonymous_page、__alloc_pages_slowpath、__alloc_pages_direct_compact、try_to_compact_pages、migrate_pages、unmap_and_move、rmap_walk、flush_tlb_mm_range、native_flush_tlb_multi 等。
- 这些函数组合清晰地说明:进程在处理匿名内存的缺页时尝试分配高阶页(通常是 THP 的 2MB 大页),因为内存碎片/压力,走到了分配的 slowpath,触发内存压实(compaction)与页面迁移,并伴随大量 TLB 刷新(shootdown)。这会让 CPU 时间被内核的页面迁移、锁竞争、IPI 调用占满,用户态几乎不跑。
这通常由以下原因触发:
- 系统启用了 THP(enabled=always 或 defrag=always),而内存出现碎片或压力,导致每次大页分配都要压实/迁移。
- 进程频繁做大块匿名内存分配/释放(例如大张量创建/销毁、数据缓冲),加剧碎片。
- 存在 pinned/locked pages(如 PyTorch 的 pin_memory、mlock、DMA/CMA),使可迁移页变少,压实更难。
- NUMA 上不均衡分配也会增加高阶分配失败概率。
现象与影响:
- CPU 使用率高但在内核;吞吐和延迟明显变差。
- perf/火焰图集中在 compaction/migrate/TLB flush。
- vmstat/top 可能同时看到 kcompactd 活跃、缺页/中断多。
临时关闭透明大页和内存规整:
echo never > /sys/kernel/mm/transparent_hugepage/enabled
echo never > /sys/kernel/mm/transparent_hugepage/defrag
关闭后从 GPFS 记载数据集的速度恢复正常。
继续挖掘
根据 numpy.core._multiarray_umath 查看 numpy v1.26.4 源码:
/*
 * This function tells whether NumPy attempts to call `madvise` with
 * `MADV_HUGEPAGE`.  `madvise` is only ever used on linux, so the value
 * of `_madvise_hugepage` may be ignored.
 *
 * It is exposed to Python as `np.core.multiarray._get_madvise_hugepage`.
 */
NPY_NO_EXPORT PyObject *
_get_madvise_hugepage(PyObject *NPY_UNUSED(self), PyObject *NPY_UNUSED(args))
{
#ifdef NPY_OS_LINUX
    if (_madvise_hugepage) {
        Py_RETURN_TRUE;
    }
#endif
    Py_RETURN_FALSE;
}

/*
 * This function enables or disables the use of `MADV_HUGEPAGE` on Linux
 * by modifying the global static `_madvise_hugepage`.
 * It returns the previous value of `_madvise_hugepage`.
 *
 * It is exposed to Python as `np.core.multiarray._set_madvise_hugepage`.
 */
NPY_NO_EXPORT PyObject *
_set_madvise_hugepage(PyObject *NPY_UNUSED(self), PyObject *enabled_obj)
{
    int was_enabled = _madvise_hugepage;
    int enabled = PyObject_IsTrue(enabled_obj);
    if (enabled < 0) {
        return NULL;
    }
    _madvise_hugepage = enabled;
    if (was_enabled) {
        Py_RETURN_TRUE;
    }
    Py_RETURN_FALSE;
}
    # We usually use madvise hugepages support, but on some old kernels it
    # is slow and thus better avoided.
    # Specifically kernel version 4.6 had a bug fix which probably fixed this:
    # https://github.com/torvalds/linux/commit/7cf91a98e607c2f935dbcc177d70011e95b8faff
    import os
    use_hugepage = os.environ.get("NUMPY_MADVISE_HUGEPAGE", None)
    if sys.platform == "linux" and use_hugepage is None:
        # If there is an issue with parsing the kernel version,
        # set use_hugepages to 0. Usage of LooseVersion will handle
        # the kernel version parsing better, but avoided since it
        # will increase the import time. See: #16679 for related discussion.
        try:
            use_hugepage = 1
            kernel_version = os.uname().release.split(".")[:2]
            kernel_version = tuple(int(v) for v in kernel_version)
            if kernel_version < (4, 6):
                use_hugepage = 0
        except ValueError:
            use_hugepages = 0
    elif use_hugepage is None:
        # This is not Linux, so it should not matter, just enable anyway
        use_hugepage = 1
    else:
        use_hugepage = int(use_hugepage)

    # Note that this will currently only make a difference on Linux
    core.multiarray._set_madvise_hugepage(use_hugepage)
    del use_hugepage
如果啥也不设置,默认使用大页,根据源码也可通过设置 NUMPY_MADVISE_HUGEPAGE 环境变量来避免使用大页。
Madvise Hugepage on Linux
-------------------------

When working with very large arrays on modern Linux kernels,
you can experience a significant speedup when
`transparent hugepage <https://www.kernel.org/doc/html/latest/admin-guide/mm/transhuge.html>`_
is used.
The current system policy for transparent hugepages can be seen by::

    cat /sys/kernel/mm/transparent_hugepage/enabled

When set to ``madvise`` NumPy will typically use hugepages for a performance
boost. This behaviour can be modified by setting the environment variable::

    NUMPY_MADVISE_HUGEPAGE=0

or setting it to ``1`` to always enable it. When not set, the default
is to use madvise on Kernels 4.6 and newer. These kernels presumably
experience a large speedup with hugepage support.
This flag is checked at import time.
numpy 调用 C malloc 来分配数组内存,但因为 Linux 上的 THP 没彻底关闭,导致分配内存自动用上了 2MB 大页。
asm_exc_page_fault 处理 Page Fault,do_huge_pmd_anonymous_page 申请 THP 处理缺页异常说明当前操作系统上已经没有连续的 2M 内存。再顺着调用链来到 try_to_compact_pages 函数,这是 Linux 内核中内存碎片整理(内存规整)的核心函数。结合系统态 CPU 使用率极高,其实此时操作系统正在整理内存碎片。
之前观察到的系统态 CPU 使用率恢复正常后,从 gpfs 读取文件的速度也随之恢复正常。
该问题非必现,是因为如果物理内存富余,能申请到连续的内存的概率大大增加,无需再额外做内存规整;相反如果物理内存吃紧且碎片多,就有极大的概率出现。
结论
-
透明大页往往会给系统带来副作用而非优化,如非必要建议关闭/禁用
# 临时关闭 echo never > /sys/kernel/mm/transparent_hugepage/enabled echo never > /sys/kernel/mm/transparent_hugepage/defrag # 持久化 # 内核启动参数设置 transparent_hugepage=never -
numa balancing 感觉不是主要问题,在数据库、低延迟等场景下也建议关闭
# 临时关闭
echo 0 > /proc/sys/kernel/numa_balancing

# 持久化
# 内核启动参数设置 numa_balancing=disable